Basque vs Immigrants from Costa Rica Poverty
COMPARE
Basque
Immigrants from Costa Rica
Poverty
Poverty Comparison
Basques
Immigrants from Costa Rica
11.9%
POVERTY
80.4/ 100
METRIC RATING
142nd/ 347
METRIC RANK
12.5%
POVERTY
33.3/ 100
METRIC RATING
188th/ 347
METRIC RANK
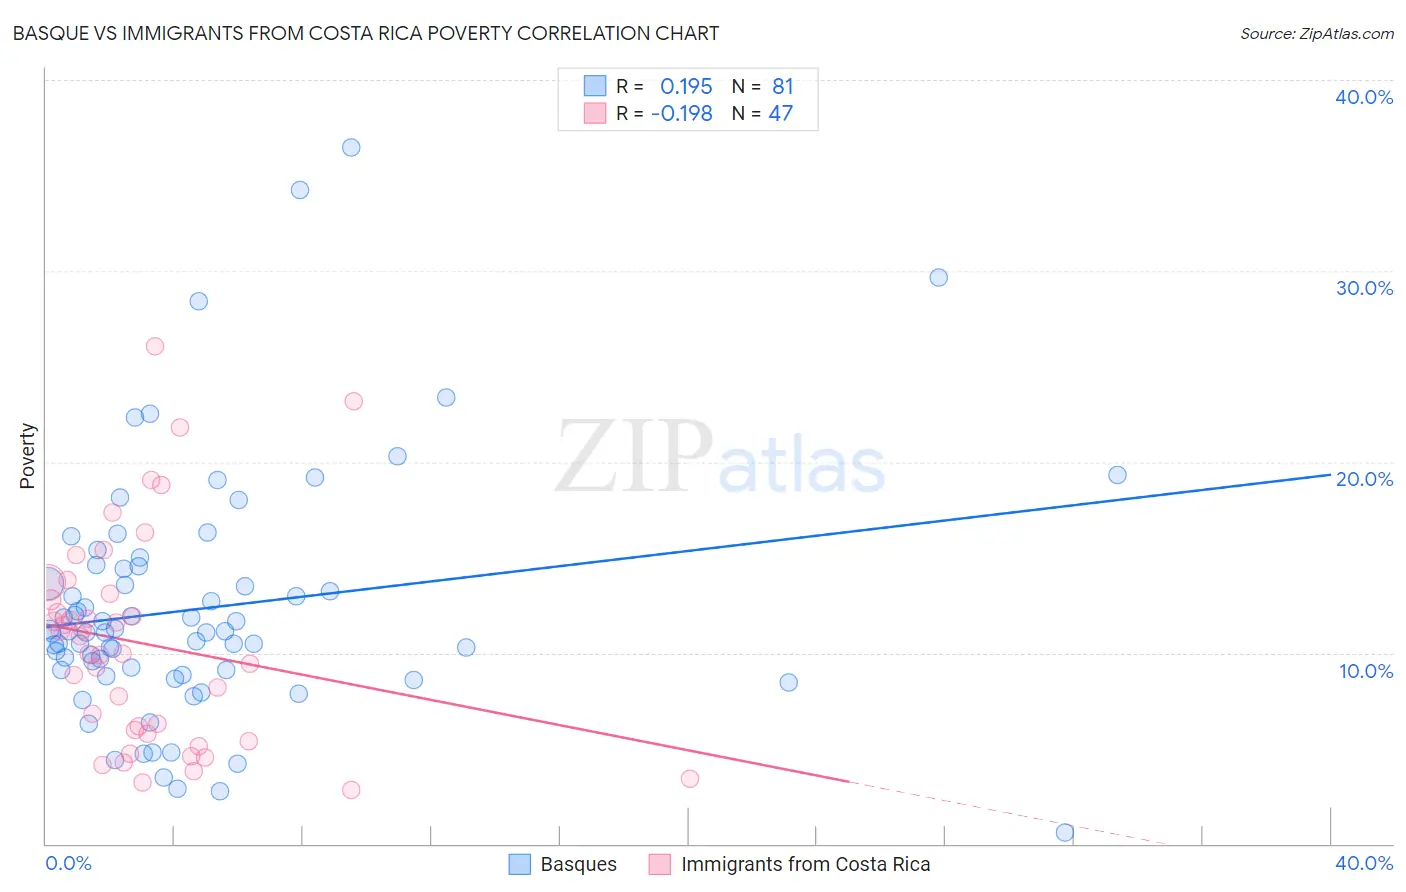
Basque vs Immigrants from Costa Rica Poverty Correlation Chart
The statistical analysis conducted on geographies consisting of 165,732,403 people shows a poor positive correlation between the proportion of Basques and poverty level in the United States with a correlation coefficient (R) of 0.195 and weighted average of 11.9%. Similarly, the statistical analysis conducted on geographies consisting of 204,257,913 people shows a poor negative correlation between the proportion of Immigrants from Costa Rica and poverty level in the United States with a correlation coefficient (R) of -0.198 and weighted average of 12.5%, a difference of 5.3%.
Poverty Correlation Summary
| Measurement | Basque | Immigrants from Costa Rica |
| Minimum | 0.59% | 2.8% |
| Maximum | 36.5% | 26.0% |
| Range | 35.9% | 23.2% |
| Mean | 12.3% | 10.5% |
| Median | 11.1% | 10.0% |
| Interquartile 25% (IQ1) | 9.0% | 5.8% |
| Interquartile 75% (IQ3) | 14.5% | 13.1% |
| Interquartile Range (IQR) | 5.5% | 7.3% |
| Standard Deviation (Sample) | 6.4% | 5.5% |
| Standard Deviation (Population) | 6.4% | 5.5% |
Similar Demographics by Poverty
Demographics Similar to Basques by Poverty
In terms of poverty, the demographic groups most similar to Basques are Immigrants from France (11.9%, a difference of 0.020%), Immigrants from Peru (11.9%, a difference of 0.11%), Brazilian (11.9%, a difference of 0.11%), Pakistani (11.9%, a difference of 0.30%), and Immigrants from Jordan (11.9%, a difference of 0.32%).
| Demographics | Rating | Rank | Poverty |
| Immigrants | Vietnam | 85.2 /100 | #135 | Excellent 11.8% |
| Chileans | 84.2 /100 | #136 | Excellent 11.8% |
| Immigrants | Switzerland | 83.0 /100 | #137 | Excellent 11.8% |
| Immigrants | Jordan | 82.4 /100 | #138 | Excellent 11.9% |
| Pakistanis | 82.2 /100 | #139 | Excellent 11.9% |
| Immigrants | Peru | 81.1 /100 | #140 | Excellent 11.9% |
| Immigrants | France | 80.5 /100 | #141 | Excellent 11.9% |
| Basques | 80.4 /100 | #142 | Excellent 11.9% |
| Brazilians | 79.7 /100 | #143 | Good 11.9% |
| Icelanders | 77.9 /100 | #144 | Good 11.9% |
| Syrians | 75.1 /100 | #145 | Good 12.0% |
| Afghans | 74.9 /100 | #146 | Good 12.0% |
| Immigrants | Bosnia and Herzegovina | 73.7 /100 | #147 | Good 12.0% |
| Immigrants | Germany | 72.7 /100 | #148 | Good 12.0% |
| Immigrants | Malaysia | 72.7 /100 | #149 | Good 12.0% |
Demographics Similar to Immigrants from Costa Rica by Poverty
In terms of poverty, the demographic groups most similar to Immigrants from Costa Rica are Aleut (12.5%, a difference of 0.010%), Hawaiian (12.5%, a difference of 0.090%), Immigrants from South America (12.5%, a difference of 0.10%), Sierra Leonean (12.6%, a difference of 0.20%), and Immigrants from Sierra Leone (12.5%, a difference of 0.32%).
| Demographics | Rating | Rank | Poverty |
| Immigrants | Afghanistan | 42.1 /100 | #181 | Average 12.4% |
| Immigrants | Cameroon | 41.7 /100 | #182 | Average 12.4% |
| Immigrants | Iraq | 40.2 /100 | #183 | Average 12.4% |
| Kenyans | 38.8 /100 | #184 | Fair 12.5% |
| Israelis | 36.4 /100 | #185 | Fair 12.5% |
| Immigrants | Sierra Leone | 36.3 /100 | #186 | Fair 12.5% |
| Hawaiians | 34.1 /100 | #187 | Fair 12.5% |
| Immigrants | Costa Rica | 33.3 /100 | #188 | Fair 12.5% |
| Aleuts | 33.2 /100 | #189 | Fair 12.5% |
| Immigrants | South America | 32.3 /100 | #190 | Fair 12.5% |
| Sierra Leoneans | 31.5 /100 | #191 | Fair 12.6% |
| South American Indians | 23.3 /100 | #192 | Fair 12.7% |
| Delaware | 21.4 /100 | #193 | Fair 12.7% |
| Arabs | 21.1 /100 | #194 | Fair 12.7% |
| Immigrants | Kuwait | 20.9 /100 | #195 | Fair 12.7% |