Alaska Native vs Central American Indian Poverty
COMPARE
Alaska Native
Central American Indian
Poverty
Poverty Comparison
Alaska Natives
Central American Indians
13.5%
POVERTY
2.1/ 100
METRIC RATING
227th/ 347
METRIC RANK
16.7%
POVERTY
0.0/ 100
METRIC RATING
325th/ 347
METRIC RANK
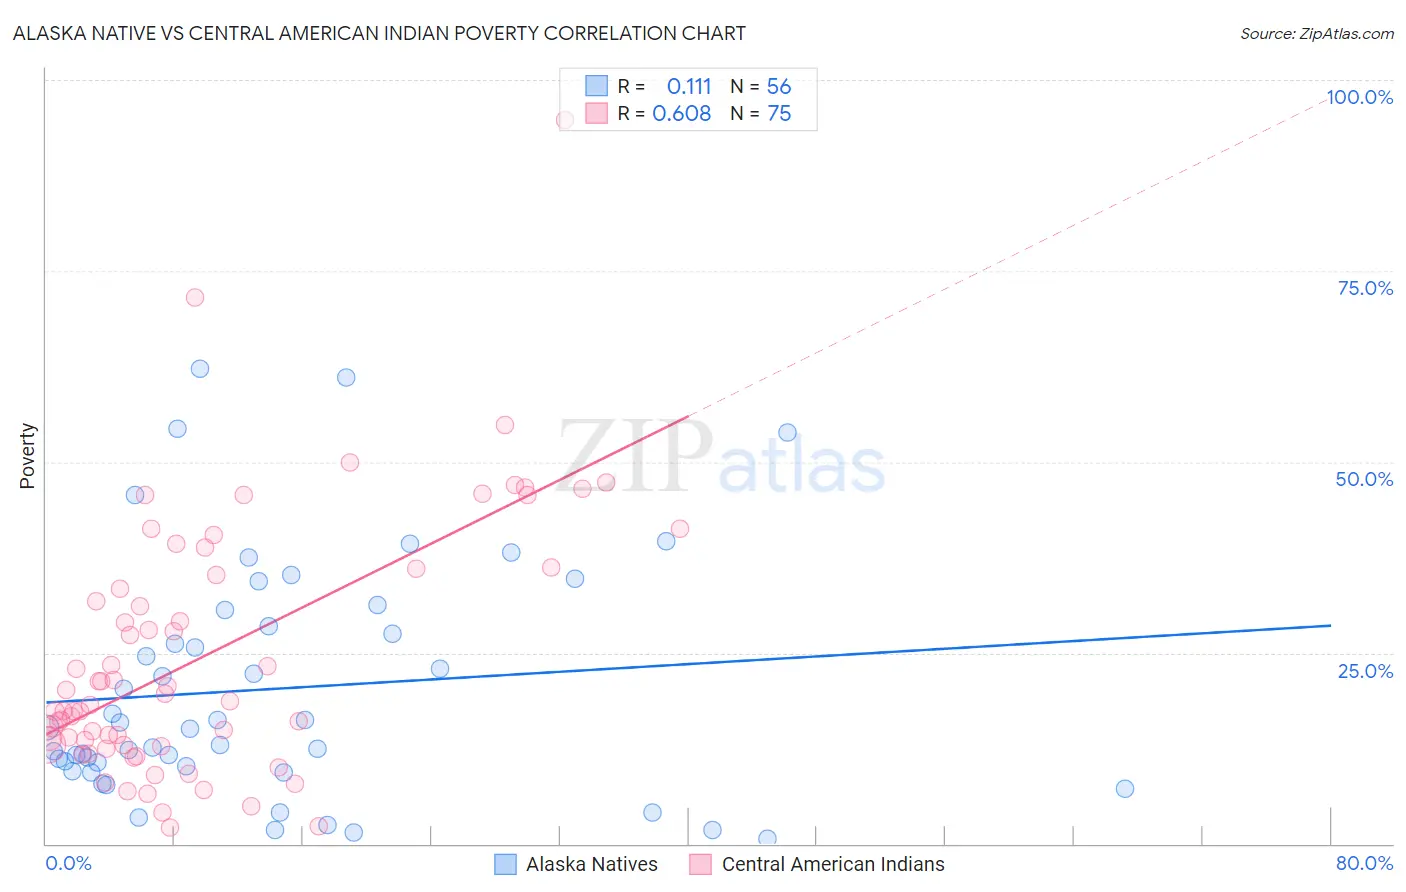
Alaska Native vs Central American Indian Poverty Correlation Chart
The statistical analysis conducted on geographies consisting of 76,760,249 people shows a poor positive correlation between the proportion of Alaska Natives and poverty level in the United States with a correlation coefficient (R) of 0.111 and weighted average of 13.5%. Similarly, the statistical analysis conducted on geographies consisting of 326,078,193 people shows a significant positive correlation between the proportion of Central American Indians and poverty level in the United States with a correlation coefficient (R) of 0.608 and weighted average of 16.7%, a difference of 23.9%.
Poverty Correlation Summary
| Measurement | Alaska Native | Central American Indian |
| Minimum | 0.63% | 2.1% |
| Maximum | 62.3% | 94.8% |
| Range | 61.6% | 92.7% |
| Mean | 20.3% | 24.6% |
| Median | 15.2% | 18.6% |
| Interquartile 25% (IQ1) | 9.8% | 12.9% |
| Interquartile 75% (IQ3) | 29.5% | 36.0% |
| Interquartile Range (IQR) | 19.7% | 23.1% |
| Standard Deviation (Sample) | 15.5% | 16.9% |
| Standard Deviation (Population) | 15.4% | 16.8% |
Similar Demographics by Poverty
Demographics Similar to Alaska Natives by Poverty
In terms of poverty, the demographic groups most similar to Alaska Natives are Marshallese (13.4%, a difference of 0.15%), German Russian (13.4%, a difference of 0.16%), Immigrants from Eritrea (13.4%, a difference of 0.38%), Immigrants from Nigeria (13.5%, a difference of 0.45%), and Immigrants from Africa (13.4%, a difference of 0.48%).
| Demographics | Rating | Rank | Poverty |
| Americans | 2.9 /100 | #220 | Tragic 13.4% |
| Alsatians | 2.6 /100 | #221 | Tragic 13.4% |
| Immigrants | Micronesia | 2.6 /100 | #222 | Tragic 13.4% |
| Immigrants | Africa | 2.5 /100 | #223 | Tragic 13.4% |
| Immigrants | Eritrea | 2.4 /100 | #224 | Tragic 13.4% |
| German Russians | 2.2 /100 | #225 | Tragic 13.4% |
| Marshallese | 2.2 /100 | #226 | Tragic 13.4% |
| Alaska Natives | 2.1 /100 | #227 | Tragic 13.5% |
| Immigrants | Nigeria | 1.7 /100 | #228 | Tragic 13.5% |
| Osage | 1.5 /100 | #229 | Tragic 13.6% |
| Alaskan Athabascans | 1.5 /100 | #230 | Tragic 13.6% |
| Nigerians | 1.4 /100 | #231 | Tragic 13.6% |
| Fijians | 0.8 /100 | #232 | Tragic 13.7% |
| Immigrants | Saudi Arabia | 0.8 /100 | #233 | Tragic 13.8% |
| Immigrants | Laos | 0.7 /100 | #234 | Tragic 13.8% |
Demographics Similar to Central American Indians by Poverty
In terms of poverty, the demographic groups most similar to Central American Indians are Yakama (16.7%, a difference of 0.23%), Paiute (16.7%, a difference of 0.29%), Colville (16.6%, a difference of 0.77%), Kiowa (16.8%, a difference of 0.82%), and Ute (16.9%, a difference of 1.3%).
| Demographics | Rating | Rank | Poverty |
| Immigrants | Dominica | 0.0 /100 | #318 | Tragic 16.1% |
| Immigrants | Congo | 0.0 /100 | #319 | Tragic 16.1% |
| Immigrants | Honduras | 0.0 /100 | #320 | Tragic 16.2% |
| Arapaho | 0.0 /100 | #321 | Tragic 16.3% |
| Menominee | 0.0 /100 | #322 | Tragic 16.4% |
| Colville | 0.0 /100 | #323 | Tragic 16.6% |
| Yakama | 0.0 /100 | #324 | Tragic 16.7% |
| Central American Indians | 0.0 /100 | #325 | Tragic 16.7% |
| Paiute | 0.0 /100 | #326 | Tragic 16.7% |
| Kiowa | 0.0 /100 | #327 | Tragic 16.8% |
| Ute | 0.0 /100 | #328 | Tragic 16.9% |
| Blacks/African Americans | 0.0 /100 | #329 | Tragic 17.3% |
| Dominicans | 0.0 /100 | #330 | Tragic 17.6% |
| Immigrants | Dominican Republic | 0.0 /100 | #331 | Tragic 17.8% |
| Natives/Alaskans | 0.0 /100 | #332 | Tragic 18.1% |