Immigrants from Kenya vs Pima Child Poverty Among Boys Under 16
COMPARE
Immigrants from Kenya
Pima
Child Poverty Among Boys Under 16
Child Poverty Among Boys Under 16 Comparison
Immigrants from Kenya
Pima
17.1%
CHILD POVERTY AMONG BOYS UNDER 16
20.1/ 100
METRIC RATING
197th/ 347
METRIC RANK
29.7%
CHILD POVERTY AMONG BOYS UNDER 16
0.0/ 100
METRIC RATING
342nd/ 347
METRIC RANK
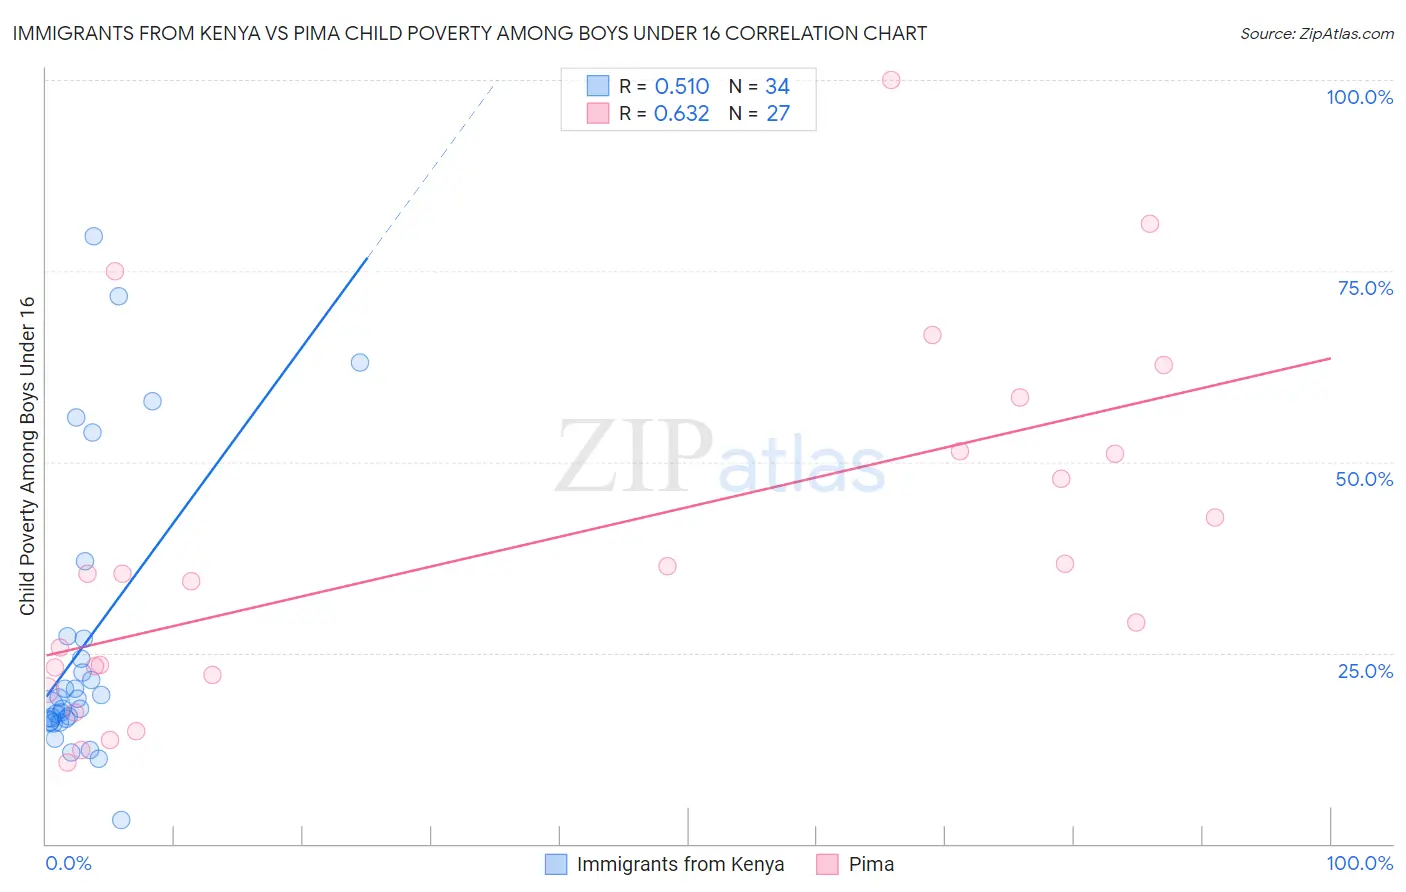
Immigrants from Kenya vs Pima Child Poverty Among Boys Under 16 Correlation Chart
The statistical analysis conducted on geographies consisting of 216,714,978 people shows a substantial positive correlation between the proportion of Immigrants from Kenya and poverty level among boys under the age of 16 in the United States with a correlation coefficient (R) of 0.510 and weighted average of 17.1%. Similarly, the statistical analysis conducted on geographies consisting of 61,443,182 people shows a significant positive correlation between the proportion of Pima and poverty level among boys under the age of 16 in the United States with a correlation coefficient (R) of 0.632 and weighted average of 29.7%, a difference of 74.3%.
Child Poverty Among Boys Under 16 Correlation Summary
| Measurement | Immigrants from Kenya | Pima |
| Minimum | 3.0% | 10.7% |
| Maximum | 79.6% | 100.0% |
| Range | 76.5% | 89.3% |
| Mean | 26.2% | 38.9% |
| Median | 18.3% | 35.3% |
| Interquartile 25% (IQ1) | 16.1% | 22.0% |
| Interquartile 75% (IQ3) | 26.8% | 51.5% |
| Interquartile Range (IQR) | 10.7% | 29.4% |
| Standard Deviation (Sample) | 18.8% | 23.1% |
| Standard Deviation (Population) | 18.5% | 22.6% |
Similar Demographics by Child Poverty Among Boys Under 16
Demographics Similar to Immigrants from Kenya by Child Poverty Among Boys Under 16
In terms of child poverty among boys under 16, the demographic groups most similar to Immigrants from Kenya are Spaniard (17.1%, a difference of 0.060%), Spanish (17.0%, a difference of 0.11%), Immigrants from Lebanon (17.0%, a difference of 0.18%), Immigrants from Cameroon (17.1%, a difference of 0.19%), and Delaware (17.1%, a difference of 0.23%).
| Demographics | Rating | Rank | Child Poverty Among Boys Under 16 |
| Arabs | 31.1 /100 | #190 | Fair 16.8% |
| Alaska Natives | 29.8 /100 | #191 | Fair 16.8% |
| Immigrants | Uganda | 21.6 /100 | #192 | Fair 17.0% |
| Immigrants | Iraq | 21.6 /100 | #193 | Fair 17.0% |
| Immigrants | Lebanon | 21.2 /100 | #194 | Fair 17.0% |
| Spanish | 20.8 /100 | #195 | Fair 17.0% |
| Spaniards | 20.5 /100 | #196 | Fair 17.1% |
| Immigrants | Kenya | 20.1 /100 | #197 | Fair 17.1% |
| Immigrants | Cameroon | 19.0 /100 | #198 | Poor 17.1% |
| Delaware | 18.8 /100 | #199 | Poor 17.1% |
| Immigrants | Uruguay | 16.9 /100 | #200 | Poor 17.2% |
| Immigrants | Afghanistan | 13.7 /100 | #201 | Poor 17.3% |
| Immigrants | Sierra Leone | 13.4 /100 | #202 | Poor 17.3% |
| Immigrants | Uzbekistan | 13.3 /100 | #203 | Poor 17.3% |
| Ugandans | 12.5 /100 | #204 | Poor 17.3% |
Demographics Similar to Pima by Child Poverty Among Boys Under 16
In terms of child poverty among boys under 16, the demographic groups most similar to Pima are Navajo (30.3%, a difference of 1.8%), Yuman (30.6%, a difference of 3.0%), Immigrants from Yemen (28.9%, a difference of 3.1%), Tohono O'odham (31.6%, a difference of 6.1%), and Lumbee (31.9%, a difference of 7.3%).
| Demographics | Rating | Rank | Child Poverty Among Boys Under 16 |
| Apache | 0.0 /100 | #333 | Tragic 24.5% |
| Blacks/African Americans | 0.0 /100 | #334 | Tragic 24.5% |
| Yup'ik | 0.0 /100 | #335 | Tragic 24.7% |
| Sioux | 0.0 /100 | #336 | Tragic 25.3% |
| Cheyenne | 0.0 /100 | #337 | Tragic 25.8% |
| Hopi | 0.0 /100 | #338 | Tragic 25.9% |
| Houma | 0.0 /100 | #339 | Tragic 26.2% |
| Crow | 0.0 /100 | #340 | Tragic 26.3% |
| Immigrants | Yemen | 0.0 /100 | #341 | Tragic 28.9% |
| Pima | 0.0 /100 | #342 | Tragic 29.7% |
| Navajo | 0.0 /100 | #343 | Tragic 30.3% |
| Yuman | 0.0 /100 | #344 | Tragic 30.6% |
| Tohono O'odham | 0.0 /100 | #345 | Tragic 31.6% |
| Lumbee | 0.0 /100 | #346 | Tragic 31.9% |
| Puerto Ricans | 0.0 /100 | #347 | Tragic 32.8% |