Colville vs Pima Child Poverty Among Boys Under 16
COMPARE
Colville
Pima
Child Poverty Among Boys Under 16
Child Poverty Among Boys Under 16 Comparison
Colville
Pima
24.1%
CHILD POVERTY AMONG BOYS UNDER 16
0.0/ 100
METRIC RATING
330th/ 347
METRIC RANK
29.7%
CHILD POVERTY AMONG BOYS UNDER 16
0.0/ 100
METRIC RATING
342nd/ 347
METRIC RANK
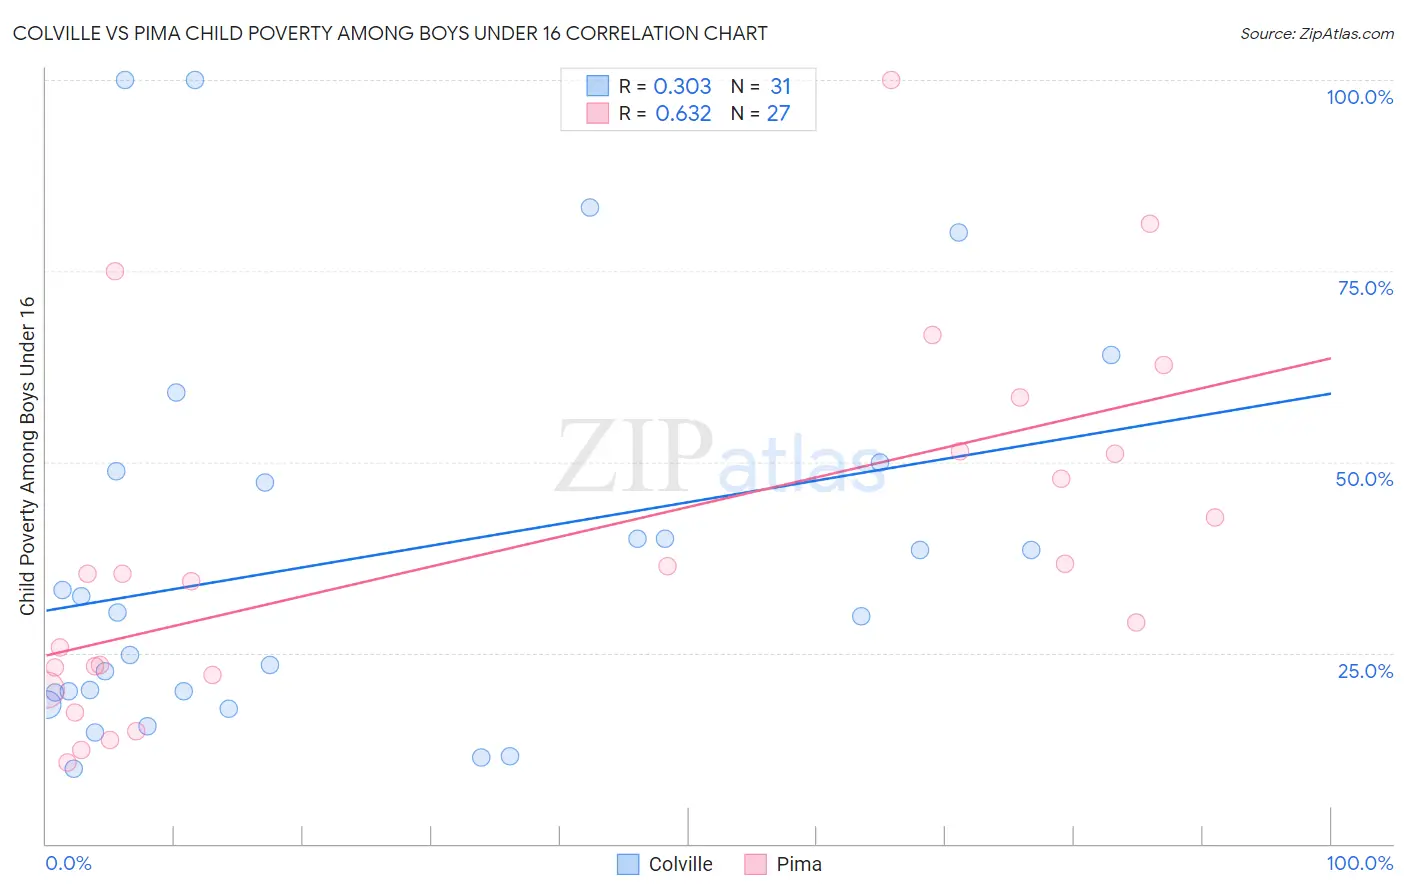
Colville vs Pima Child Poverty Among Boys Under 16 Correlation Chart
The statistical analysis conducted on geographies consisting of 34,562,451 people shows a mild positive correlation between the proportion of Colville and poverty level among boys under the age of 16 in the United States with a correlation coefficient (R) of 0.303 and weighted average of 24.1%. Similarly, the statistical analysis conducted on geographies consisting of 61,443,182 people shows a significant positive correlation between the proportion of Pima and poverty level among boys under the age of 16 in the United States with a correlation coefficient (R) of 0.632 and weighted average of 29.7%, a difference of 23.4%.
Child Poverty Among Boys Under 16 Correlation Summary
| Measurement | Colville | Pima |
| Minimum | 9.8% | 10.7% |
| Maximum | 100.0% | 100.0% |
| Range | 90.2% | 89.3% |
| Mean | 37.5% | 38.9% |
| Median | 30.4% | 35.3% |
| Interquartile 25% (IQ1) | 19.7% | 22.0% |
| Interquartile 75% (IQ3) | 48.8% | 51.5% |
| Interquartile Range (IQR) | 29.1% | 29.4% |
| Standard Deviation (Sample) | 25.3% | 23.1% |
| Standard Deviation (Population) | 24.9% | 22.6% |
Demographics Similar to Colville and Pima by Child Poverty Among Boys Under 16
In terms of child poverty among boys under 16, the demographic groups most similar to Colville are Dominican (24.2%, a difference of 0.34%), Native/Alaskan (24.0%, a difference of 0.58%), Immigrants from Dominican Republic (24.3%, a difference of 0.93%), Apache (24.5%, a difference of 1.7%), and Black/African American (24.5%, a difference of 1.8%). Similarly, the demographic groups most similar to Pima are Navajo (30.3%, a difference of 1.8%), Yuman (30.6%, a difference of 3.0%), Immigrants from Yemen (28.9%, a difference of 3.1%), Tohono O'odham (31.6%, a difference of 6.1%), and Lumbee (31.9%, a difference of 7.3%).
| Demographics | Rating | Rank | Child Poverty Among Boys Under 16 |
| Paiute | 0.0 /100 | #326 | Tragic 22.8% |
| Immigrants | Honduras | 0.0 /100 | #327 | Tragic 22.8% |
| Pueblo | 0.0 /100 | #328 | Tragic 23.5% |
| Natives/Alaskans | 0.0 /100 | #329 | Tragic 24.0% |
| Colville | 0.0 /100 | #330 | Tragic 24.1% |
| Dominicans | 0.0 /100 | #331 | Tragic 24.2% |
| Immigrants | Dominican Republic | 0.0 /100 | #332 | Tragic 24.3% |
| Apache | 0.0 /100 | #333 | Tragic 24.5% |
| Blacks/African Americans | 0.0 /100 | #334 | Tragic 24.5% |
| Yup'ik | 0.0 /100 | #335 | Tragic 24.7% |
| Sioux | 0.0 /100 | #336 | Tragic 25.3% |
| Cheyenne | 0.0 /100 | #337 | Tragic 25.8% |
| Hopi | 0.0 /100 | #338 | Tragic 25.9% |
| Houma | 0.0 /100 | #339 | Tragic 26.2% |
| Crow | 0.0 /100 | #340 | Tragic 26.3% |
| Immigrants | Yemen | 0.0 /100 | #341 | Tragic 28.9% |
| Pima | 0.0 /100 | #342 | Tragic 29.7% |
| Navajo | 0.0 /100 | #343 | Tragic 30.3% |
| Yuman | 0.0 /100 | #344 | Tragic 30.6% |
| Tohono O'odham | 0.0 /100 | #345 | Tragic 31.6% |
| Lumbee | 0.0 /100 | #346 | Tragic 31.9% |