Immigrants from Kenya vs Immigrants from Bahamas Child Poverty Among Boys Under 16
COMPARE
Immigrants from Kenya
Immigrants from Bahamas
Child Poverty Among Boys Under 16
Child Poverty Among Boys Under 16 Comparison
Immigrants from Kenya
Immigrants from Bahamas
17.1%
CHILD POVERTY AMONG BOYS UNDER 16
20.1/ 100
METRIC RATING
197th/ 347
METRIC RANK
20.7%
CHILD POVERTY AMONG BOYS UNDER 16
0.0/ 100
METRIC RATING
294th/ 347
METRIC RANK
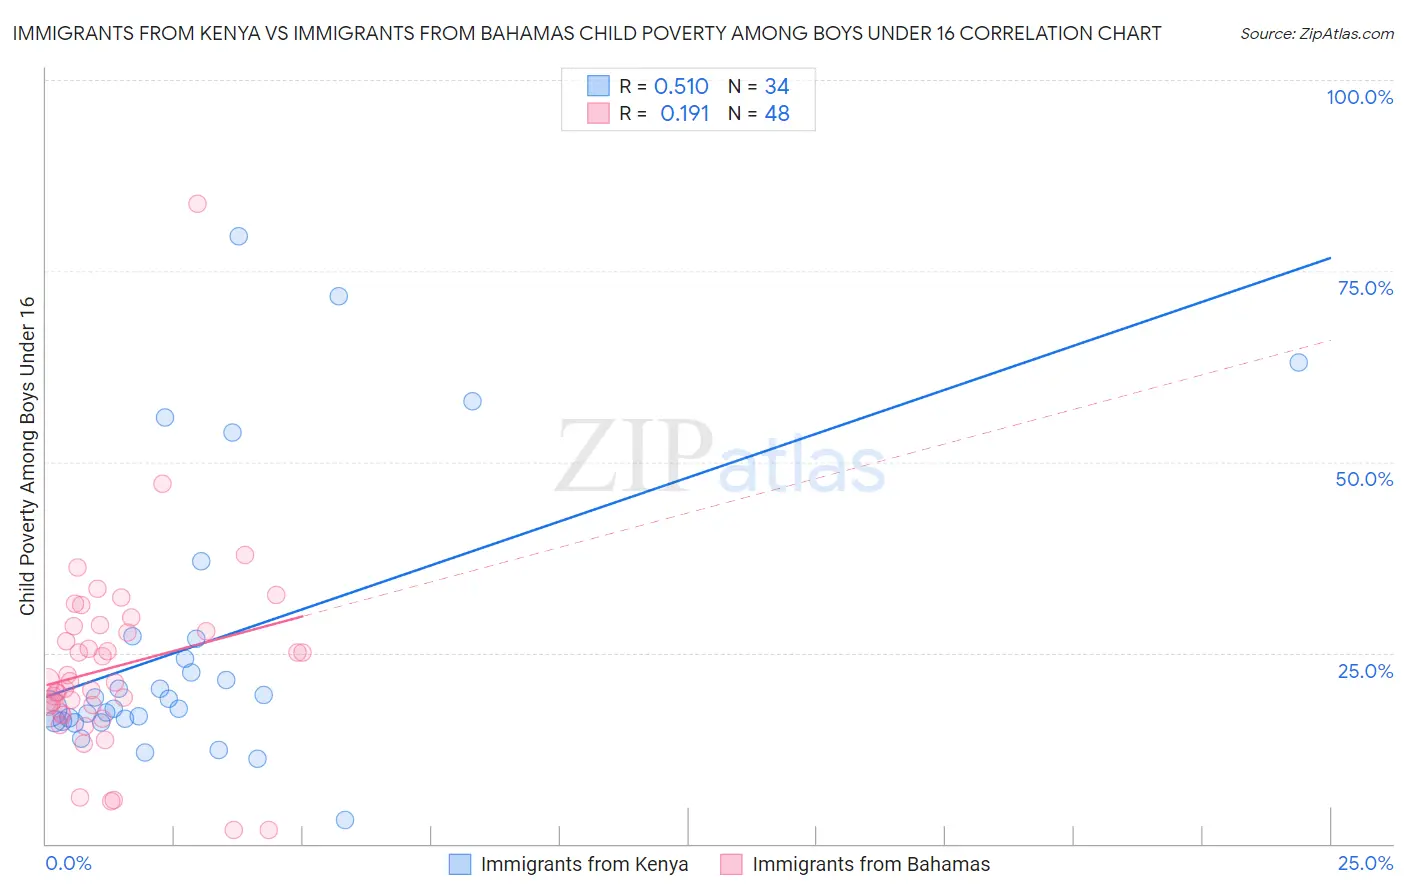
Immigrants from Kenya vs Immigrants from Bahamas Child Poverty Among Boys Under 16 Correlation Chart
The statistical analysis conducted on geographies consisting of 216,714,978 people shows a substantial positive correlation between the proportion of Immigrants from Kenya and poverty level among boys under the age of 16 in the United States with a correlation coefficient (R) of 0.510 and weighted average of 17.1%. Similarly, the statistical analysis conducted on geographies consisting of 104,324,399 people shows a poor positive correlation between the proportion of Immigrants from Bahamas and poverty level among boys under the age of 16 in the United States with a correlation coefficient (R) of 0.191 and weighted average of 20.7%, a difference of 21.4%.
Child Poverty Among Boys Under 16 Correlation Summary
| Measurement | Immigrants from Kenya | Immigrants from Bahamas |
| Minimum | 3.0% | 1.7% |
| Maximum | 79.6% | 83.9% |
| Range | 76.5% | 82.1% |
| Mean | 26.2% | 23.1% |
| Median | 18.3% | 21.2% |
| Interquartile 25% (IQ1) | 16.1% | 17.6% |
| Interquartile 75% (IQ3) | 26.8% | 28.2% |
| Interquartile Range (IQR) | 10.7% | 10.6% |
| Standard Deviation (Sample) | 18.8% | 12.8% |
| Standard Deviation (Population) | 18.5% | 12.6% |
Similar Demographics by Child Poverty Among Boys Under 16
Demographics Similar to Immigrants from Kenya by Child Poverty Among Boys Under 16
In terms of child poverty among boys under 16, the demographic groups most similar to Immigrants from Kenya are Spaniard (17.1%, a difference of 0.060%), Spanish (17.0%, a difference of 0.11%), Immigrants from Lebanon (17.0%, a difference of 0.18%), Immigrants from Cameroon (17.1%, a difference of 0.19%), and Delaware (17.1%, a difference of 0.23%).
| Demographics | Rating | Rank | Child Poverty Among Boys Under 16 |
| Arabs | 31.1 /100 | #190 | Fair 16.8% |
| Alaska Natives | 29.8 /100 | #191 | Fair 16.8% |
| Immigrants | Uganda | 21.6 /100 | #192 | Fair 17.0% |
| Immigrants | Iraq | 21.6 /100 | #193 | Fair 17.0% |
| Immigrants | Lebanon | 21.2 /100 | #194 | Fair 17.0% |
| Spanish | 20.8 /100 | #195 | Fair 17.0% |
| Spaniards | 20.5 /100 | #196 | Fair 17.1% |
| Immigrants | Kenya | 20.1 /100 | #197 | Fair 17.1% |
| Immigrants | Cameroon | 19.0 /100 | #198 | Poor 17.1% |
| Delaware | 18.8 /100 | #199 | Poor 17.1% |
| Immigrants | Uruguay | 16.9 /100 | #200 | Poor 17.2% |
| Immigrants | Afghanistan | 13.7 /100 | #201 | Poor 17.3% |
| Immigrants | Sierra Leone | 13.4 /100 | #202 | Poor 17.3% |
| Immigrants | Uzbekistan | 13.3 /100 | #203 | Poor 17.3% |
| Ugandans | 12.5 /100 | #204 | Poor 17.3% |
Demographics Similar to Immigrants from Bahamas by Child Poverty Among Boys Under 16
In terms of child poverty among boys under 16, the demographic groups most similar to Immigrants from Bahamas are Immigrants from Senegal (20.7%, a difference of 0.11%), Yaqui (20.7%, a difference of 0.13%), Mexican (20.7%, a difference of 0.13%), Indonesian (20.8%, a difference of 0.32%), and Immigrants from Latin America (20.6%, a difference of 0.39%).
| Demographics | Rating | Rank | Child Poverty Among Boys Under 16 |
| Immigrants | Belize | 0.0 /100 | #287 | Tragic 20.3% |
| Immigrants | St. Vincent and the Grenadines | 0.0 /100 | #288 | Tragic 20.3% |
| Blackfeet | 0.0 /100 | #289 | Tragic 20.4% |
| Senegalese | 0.0 /100 | #290 | Tragic 20.6% |
| Immigrants | Latin America | 0.0 /100 | #291 | Tragic 20.6% |
| Yaqui | 0.0 /100 | #292 | Tragic 20.7% |
| Immigrants | Senegal | 0.0 /100 | #293 | Tragic 20.7% |
| Immigrants | Bahamas | 0.0 /100 | #294 | Tragic 20.7% |
| Mexicans | 0.0 /100 | #295 | Tragic 20.7% |
| Indonesians | 0.0 /100 | #296 | Tragic 20.8% |
| Hispanics or Latinos | 0.0 /100 | #297 | Tragic 20.9% |
| Chippewa | 0.0 /100 | #298 | Tragic 21.0% |
| Immigrants | Caribbean | 0.0 /100 | #299 | Tragic 21.0% |
| Haitians | 0.0 /100 | #300 | Tragic 21.0% |
| Guatemalans | 0.0 /100 | #301 | Tragic 21.1% |