Immigrants from Poland vs Immigrants from Latvia Family Poverty
COMPARE
Immigrants from Poland
Immigrants from Latvia
Family Poverty
Family Poverty Comparison
Immigrants from Poland
Immigrants from Latvia
7.9%
FAMILY POVERTY
97.8/ 100
METRIC RATING
82nd/ 347
METRIC RANK
7.9%
FAMILY POVERTY
98.0/ 100
METRIC RATING
76th/ 347
METRIC RANK
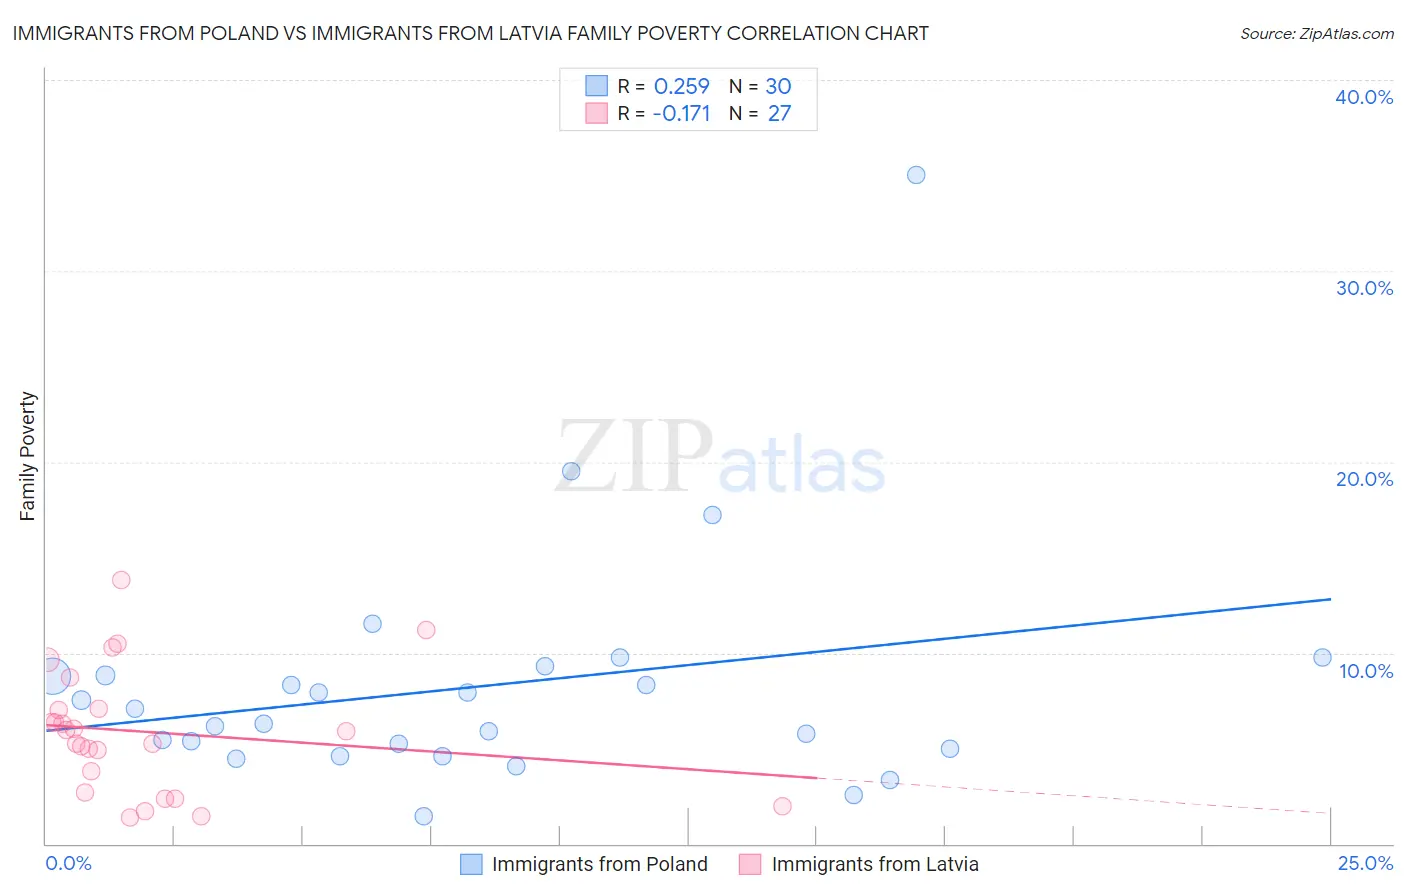
Immigrants from Poland vs Immigrants from Latvia Family Poverty Correlation Chart
The statistical analysis conducted on geographies consisting of 304,048,718 people shows a weak positive correlation between the proportion of Immigrants from Poland and poverty level among families in the United States with a correlation coefficient (R) of 0.259 and weighted average of 7.9%. Similarly, the statistical analysis conducted on geographies consisting of 113,662,762 people shows a poor negative correlation between the proportion of Immigrants from Latvia and poverty level among families in the United States with a correlation coefficient (R) of -0.171 and weighted average of 7.9%, a difference of 0.30%.
Family Poverty Correlation Summary
| Measurement | Immigrants from Poland | Immigrants from Latvia |
| Minimum | 1.5% | 1.4% |
| Maximum | 35.0% | 13.8% |
| Range | 33.5% | 12.5% |
| Mean | 8.2% | 5.9% |
| Median | 6.7% | 5.9% |
| Interquartile 25% (IQ1) | 5.0% | 2.7% |
| Interquartile 75% (IQ3) | 8.8% | 7.1% |
| Interquartile Range (IQR) | 3.8% | 4.4% |
| Standard Deviation (Sample) | 6.3% | 3.2% |
| Standard Deviation (Population) | 6.2% | 3.2% |
Demographics Similar to Immigrants from Poland and Immigrants from Latvia by Family Poverty
In terms of family poverty, the demographic groups most similar to Immigrants from Poland are English (7.9%, a difference of 0.030%), Irish (7.9%, a difference of 0.030%), Immigrants from Europe (7.9%, a difference of 0.090%), Immigrants from North America (7.9%, a difference of 0.17%), and Slovak (7.9%, a difference of 0.18%). Similarly, the demographic groups most similar to Immigrants from Latvia are Ukrainian (7.9%, a difference of 0.010%), Immigrants from North America (7.9%, a difference of 0.12%), Immigrants from Europe (7.9%, a difference of 0.20%), Immigrants from Croatia (7.8%, a difference of 0.23%), and English (7.9%, a difference of 0.26%).
| Demographics | Rating | Rank | Family Poverty |
| Immigrants | Belgium | 98.2 /100 | #69 | Exceptional 7.8% |
| Immigrants | Canada | 98.2 /100 | #70 | Exceptional 7.8% |
| Cambodians | 98.2 /100 | #71 | Exceptional 7.8% |
| Immigrants | Romania | 98.2 /100 | #72 | Exceptional 7.8% |
| Austrians | 98.2 /100 | #73 | Exceptional 7.8% |
| Immigrants | China | 98.1 /100 | #74 | Exceptional 7.8% |
| Immigrants | Croatia | 98.1 /100 | #75 | Exceptional 7.8% |
| Immigrants | Latvia | 98.0 /100 | #76 | Exceptional 7.9% |
| Ukrainians | 98.0 /100 | #77 | Exceptional 7.9% |
| Immigrants | North America | 97.9 /100 | #78 | Exceptional 7.9% |
| Immigrants | Europe | 97.8 /100 | #79 | Exceptional 7.9% |
| English | 97.8 /100 | #80 | Exceptional 7.9% |
| Irish | 97.8 /100 | #81 | Exceptional 7.9% |
| Immigrants | Poland | 97.8 /100 | #82 | Exceptional 7.9% |
| Slovaks | 97.7 /100 | #83 | Exceptional 7.9% |
| British | 97.5 /100 | #84 | Exceptional 7.9% |
| Immigrants | Asia | 97.4 /100 | #85 | Exceptional 7.9% |
| Scottish | 97.3 /100 | #86 | Exceptional 7.9% |
| Belgians | 97.3 /100 | #87 | Exceptional 8.0% |
| Serbians | 97.2 /100 | #88 | Exceptional 8.0% |
| Immigrants | Denmark | 97.1 /100 | #89 | Exceptional 8.0% |