Immigrants from Kazakhstan vs Immigrants from Latvia Unemployment Among Women with Children Under 18 years
COMPARE
Immigrants from Kazakhstan
Immigrants from Latvia
Unemployment Among Women with Children Under 18 years
Unemployment Among Women with Children Under 18 years Comparison
Immigrants from Kazakhstan
Immigrants from Latvia
5.4%
UNEMPLOYMENT AMONG WOMEN WITH CHILDREN UNDER 18 YEARS
51.7/ 100
METRIC RATING
172nd/ 347
METRIC RANK
5.4%
UNEMPLOYMENT AMONG WOMEN WITH CHILDREN UNDER 18 YEARS
70.8/ 100
METRIC RATING
154th/ 347
METRIC RANK
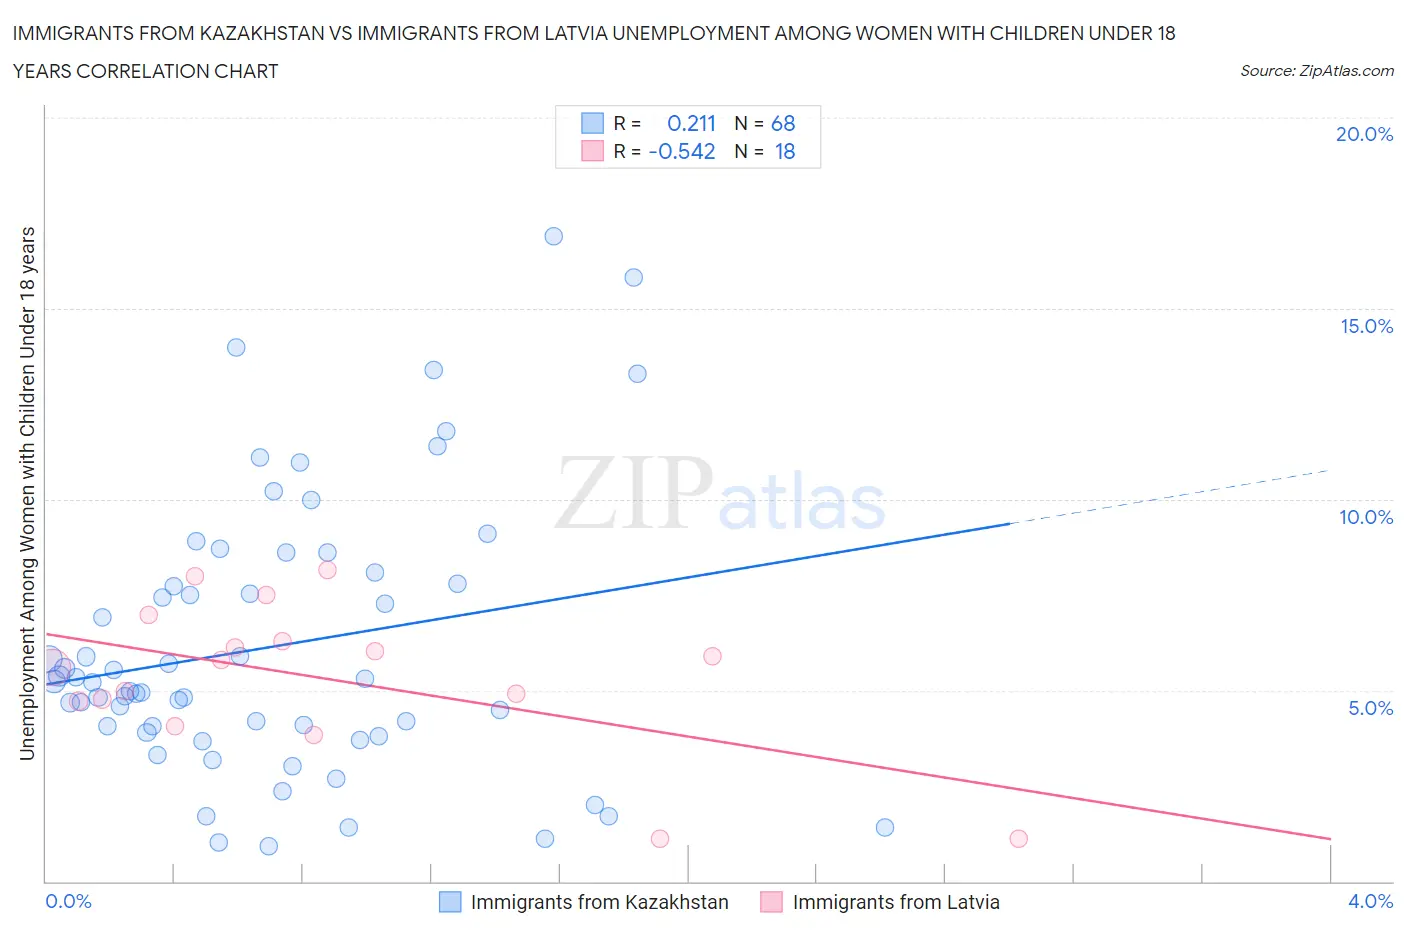
Immigrants from Kazakhstan vs Immigrants from Latvia Unemployment Among Women with Children Under 18 years Correlation Chart
The statistical analysis conducted on geographies consisting of 122,704,212 people shows a weak positive correlation between the proportion of Immigrants from Kazakhstan and unemployment rate among women with children under the age of 18 in the United States with a correlation coefficient (R) of 0.211 and weighted average of 5.4%. Similarly, the statistical analysis conducted on geographies consisting of 112,221,159 people shows a substantial negative correlation between the proportion of Immigrants from Latvia and unemployment rate among women with children under the age of 18 in the United States with a correlation coefficient (R) of -0.542 and weighted average of 5.4%, a difference of 1.5%.
Unemployment Among Women with Children Under 18 years Correlation Summary
| Measurement | Immigrants from Kazakhstan | Immigrants from Latvia |
| Minimum | 0.92% | 1.1% |
| Maximum | 16.9% | 8.2% |
| Range | 16.0% | 7.1% |
| Mean | 6.1% | 5.3% |
| Median | 5.2% | 5.7% |
| Interquartile 25% (IQ1) | 4.0% | 4.7% |
| Interquartile 75% (IQ3) | 8.0% | 6.3% |
| Interquartile Range (IQR) | 4.0% | 1.6% |
| Standard Deviation (Sample) | 3.6% | 2.0% |
| Standard Deviation (Population) | 3.6% | 1.9% |
Demographics Similar to Immigrants from Kazakhstan and Immigrants from Latvia by Unemployment Among Women with Children Under 18 years
In terms of unemployment among women with children under 18 years, the demographic groups most similar to Immigrants from Kazakhstan are Immigrants from Eastern Africa (5.4%, a difference of 0.030%), Immigrants from Philippines (5.4%, a difference of 0.10%), Samoan (5.4%, a difference of 0.17%), Immigrants from Thailand (5.4%, a difference of 0.26%), and Immigrants from Northern Africa (5.4%, a difference of 0.31%). Similarly, the demographic groups most similar to Immigrants from Latvia are Carpatho Rusyn (5.4%, a difference of 0.0%), Korean (5.4%, a difference of 0.020%), South African (5.4%, a difference of 0.040%), German Russian (5.4%, a difference of 0.050%), and Immigrants from Burma/Myanmar (5.4%, a difference of 0.11%).
| Demographics | Rating | Rank | Unemployment Among Women with Children Under 18 years |
| Carpatho Rusyns | 70.8 /100 | #153 | Good 5.4% |
| Immigrants | Latvia | 70.8 /100 | #154 | Good 5.4% |
| Koreans | 70.5 /100 | #155 | Good 5.4% |
| South Africans | 70.3 /100 | #156 | Good 5.4% |
| German Russians | 70.2 /100 | #157 | Good 5.4% |
| Immigrants | Burma/Myanmar | 69.5 /100 | #158 | Good 5.4% |
| Chickasaw | 68.4 /100 | #159 | Good 5.4% |
| Afghans | 66.6 /100 | #160 | Good 5.4% |
| Immigrants | Iraq | 65.9 /100 | #161 | Good 5.4% |
| Immigrants | Saudi Arabia | 65.0 /100 | #162 | Good 5.4% |
| Lebanese | 64.7 /100 | #163 | Good 5.4% |
| Celtics | 63.0 /100 | #164 | Good 5.4% |
| Tlingit-Haida | 61.9 /100 | #165 | Good 5.4% |
| Aleuts | 59.4 /100 | #166 | Average 5.4% |
| Immigrants | Denmark | 58.0 /100 | #167 | Average 5.4% |
| Immigrants | Northern Africa | 56.1 /100 | #168 | Average 5.4% |
| Immigrants | Thailand | 55.3 /100 | #169 | Average 5.4% |
| Samoans | 54.1 /100 | #170 | Average 5.4% |
| Immigrants | Philippines | 53.1 /100 | #171 | Average 5.4% |
| Immigrants | Kazakhstan | 51.7 /100 | #172 | Average 5.4% |
| Immigrants | Eastern Africa | 51.3 /100 | #173 | Average 5.4% |