Sioux vs Immigrants from Latvia Family Poverty
COMPARE
Sioux
Immigrants from Latvia
Family Poverty
Family Poverty Comparison
Sioux
Immigrants from Latvia
15.9%
FAMILY POVERTY
0.0/ 100
METRIC RATING
336th/ 347
METRIC RANK
7.9%
FAMILY POVERTY
98.0/ 100
METRIC RATING
76th/ 347
METRIC RANK
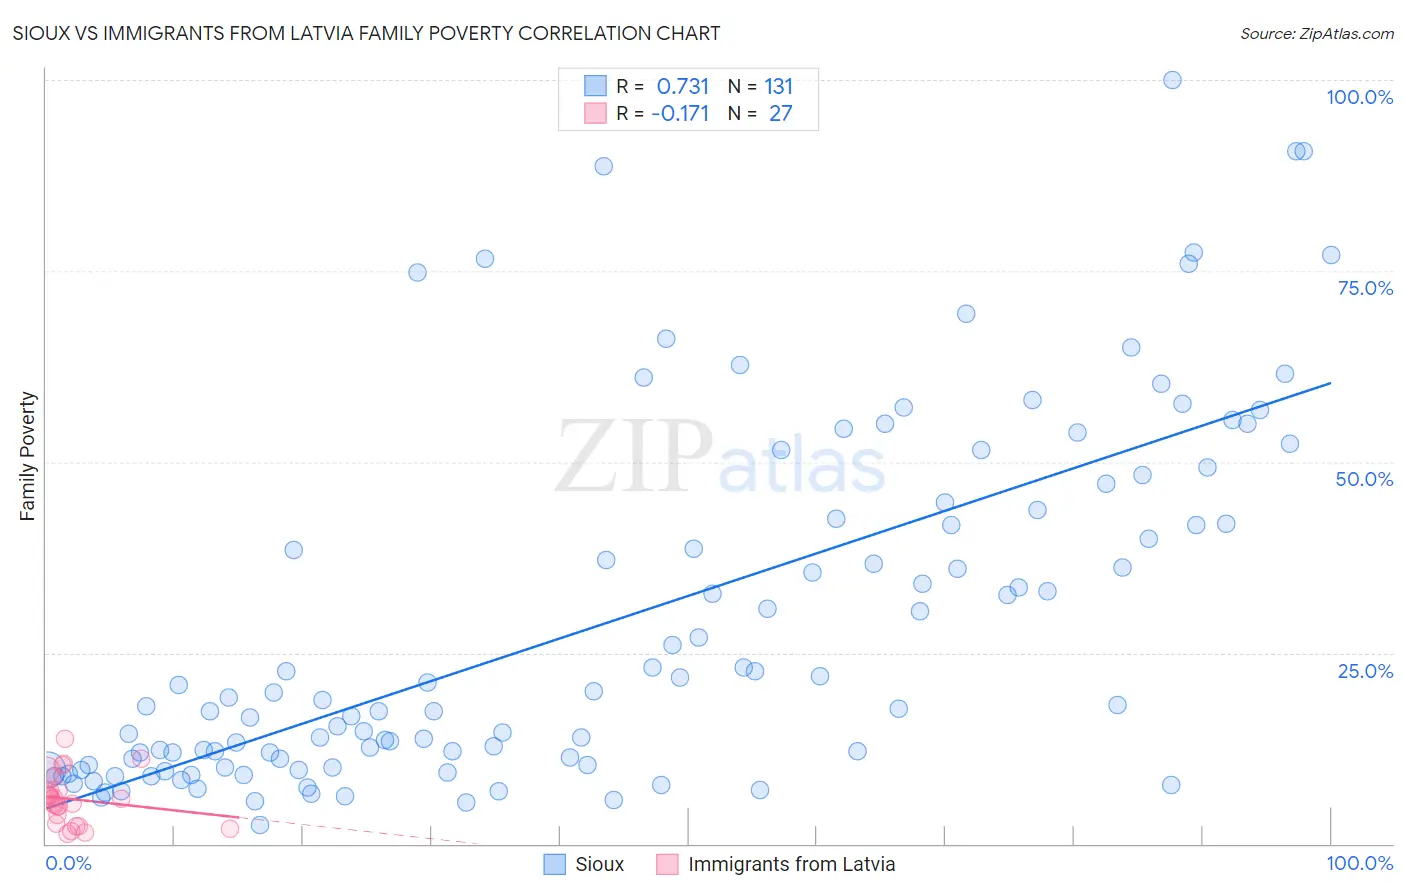
Sioux vs Immigrants from Latvia Family Poverty Correlation Chart
The statistical analysis conducted on geographies consisting of 233,799,830 people shows a strong positive correlation between the proportion of Sioux and poverty level among families in the United States with a correlation coefficient (R) of 0.731 and weighted average of 15.9%. Similarly, the statistical analysis conducted on geographies consisting of 113,662,762 people shows a poor negative correlation between the proportion of Immigrants from Latvia and poverty level among families in the United States with a correlation coefficient (R) of -0.171 and weighted average of 7.9%, a difference of 101.6%.
Family Poverty Correlation Summary
| Measurement | Sioux | Immigrants from Latvia |
| Minimum | 2.5% | 1.4% |
| Maximum | 100.0% | 13.8% |
| Range | 97.5% | 12.5% |
| Mean | 29.0% | 5.9% |
| Median | 18.8% | 5.9% |
| Interquartile 25% (IQ1) | 10.3% | 2.7% |
| Interquartile 75% (IQ3) | 43.6% | 7.1% |
| Interquartile Range (IQR) | 33.4% | 4.4% |
| Standard Deviation (Sample) | 23.2% | 3.2% |
| Standard Deviation (Population) | 23.1% | 3.2% |
Similar Demographics by Family Poverty
Demographics Similar to Sioux by Family Poverty
In terms of family poverty, the demographic groups most similar to Sioux are Hopi (15.9%, a difference of 0.47%), Crow (16.1%, a difference of 1.6%), Yuman (16.6%, a difference of 5.0%), Pueblo (17.0%, a difference of 7.1%), and Lumbee (17.0%, a difference of 7.2%).
| Demographics | Rating | Rank | Family Poverty |
| Blacks/African Americans | 0.0 /100 | #329 | Tragic 13.3% |
| Natives/Alaskans | 0.0 /100 | #330 | Tragic 14.3% |
| Cheyenne | 0.0 /100 | #331 | Tragic 14.3% |
| Dominicans | 0.0 /100 | #332 | Tragic 14.3% |
| Immigrants | Dominican Republic | 0.0 /100 | #333 | Tragic 14.4% |
| Houma | 0.0 /100 | #334 | Tragic 14.6% |
| Apache | 0.0 /100 | #335 | Tragic 14.7% |
| Sioux | 0.0 /100 | #336 | Tragic 15.9% |
| Hopi | 0.0 /100 | #337 | Tragic 15.9% |
| Crow | 0.0 /100 | #338 | Tragic 16.1% |
| Yuman | 0.0 /100 | #339 | Tragic 16.6% |
| Pueblo | 0.0 /100 | #340 | Tragic 17.0% |
| Lumbee | 0.0 /100 | #341 | Tragic 17.0% |
| Immigrants | Yemen | 0.0 /100 | #342 | Tragic 17.5% |
| Pima | 0.0 /100 | #343 | Tragic 18.4% |
Demographics Similar to Immigrants from Latvia by Family Poverty
In terms of family poverty, the demographic groups most similar to Immigrants from Latvia are Ukrainian (7.9%, a difference of 0.010%), Immigrants from North America (7.9%, a difference of 0.12%), Immigrants from Europe (7.9%, a difference of 0.20%), Immigrants from Croatia (7.8%, a difference of 0.23%), and English (7.9%, a difference of 0.26%).
| Demographics | Rating | Rank | Family Poverty |
| Immigrants | Belgium | 98.2 /100 | #69 | Exceptional 7.8% |
| Immigrants | Canada | 98.2 /100 | #70 | Exceptional 7.8% |
| Cambodians | 98.2 /100 | #71 | Exceptional 7.8% |
| Immigrants | Romania | 98.2 /100 | #72 | Exceptional 7.8% |
| Austrians | 98.2 /100 | #73 | Exceptional 7.8% |
| Immigrants | China | 98.1 /100 | #74 | Exceptional 7.8% |
| Immigrants | Croatia | 98.1 /100 | #75 | Exceptional 7.8% |
| Immigrants | Latvia | 98.0 /100 | #76 | Exceptional 7.9% |
| Ukrainians | 98.0 /100 | #77 | Exceptional 7.9% |
| Immigrants | North America | 97.9 /100 | #78 | Exceptional 7.9% |
| Immigrants | Europe | 97.8 /100 | #79 | Exceptional 7.9% |
| English | 97.8 /100 | #80 | Exceptional 7.9% |
| Irish | 97.8 /100 | #81 | Exceptional 7.9% |
| Immigrants | Poland | 97.8 /100 | #82 | Exceptional 7.9% |
| Slovaks | 97.7 /100 | #83 | Exceptional 7.9% |