Immigrants from Jordan vs Immigrants from Czechoslovakia Poverty
COMPARE
Immigrants from Jordan
Immigrants from Czechoslovakia
Poverty
Poverty Comparison
Immigrants from Jordan
Immigrants from Czechoslovakia
11.9%
POVERTY
82.4/ 100
METRIC RATING
138th/ 347
METRIC RANK
11.0%
POVERTY
98.9/ 100
METRIC RATING
46th/ 347
METRIC RANK
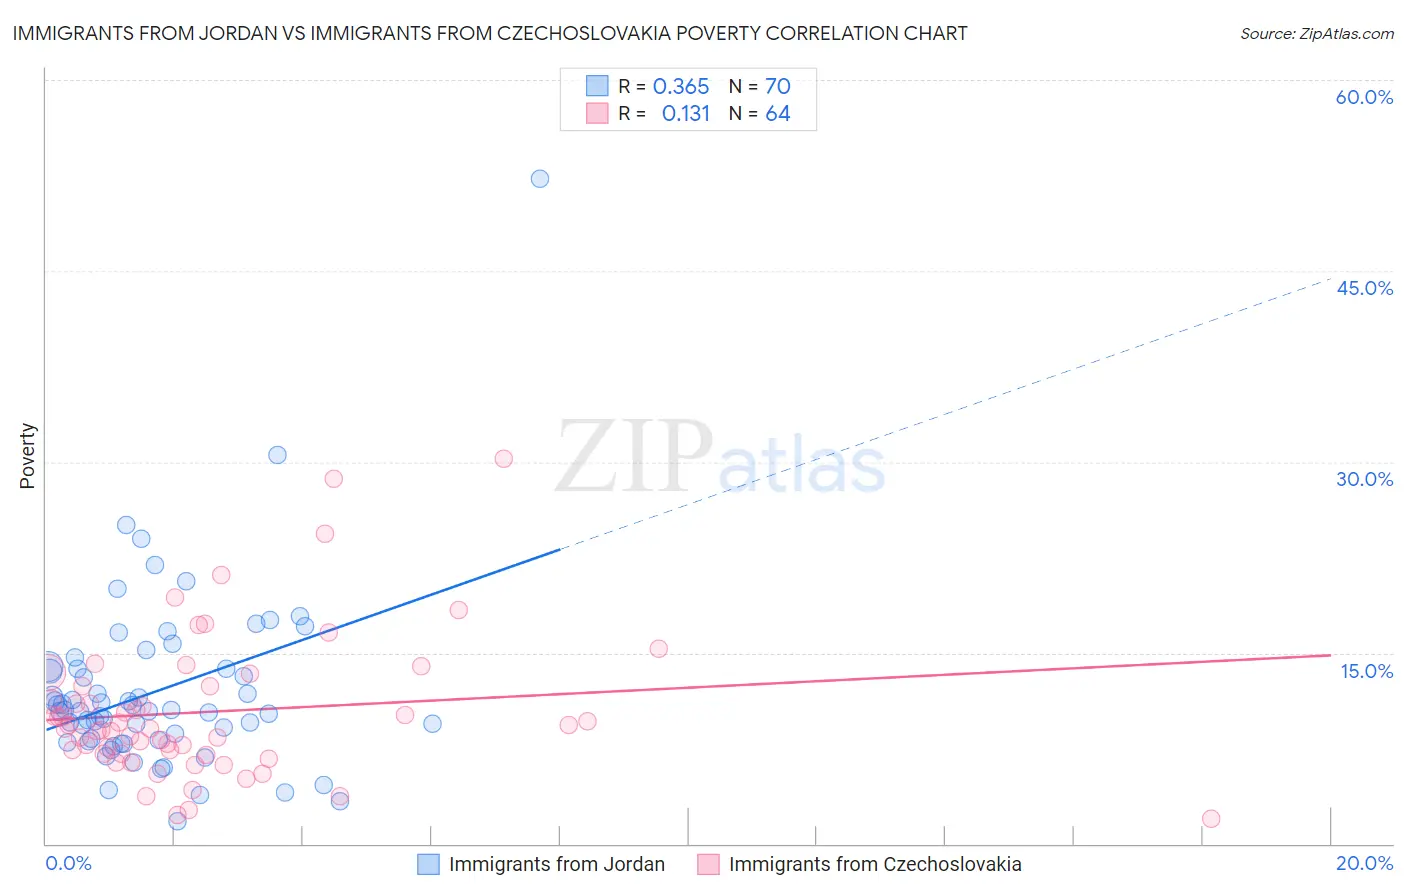
Immigrants from Jordan vs Immigrants from Czechoslovakia Poverty Correlation Chart
The statistical analysis conducted on geographies consisting of 181,257,123 people shows a mild positive correlation between the proportion of Immigrants from Jordan and poverty level in the United States with a correlation coefficient (R) of 0.365 and weighted average of 11.9%. Similarly, the statistical analysis conducted on geographies consisting of 195,452,968 people shows a poor positive correlation between the proportion of Immigrants from Czechoslovakia and poverty level in the United States with a correlation coefficient (R) of 0.131 and weighted average of 11.0%, a difference of 8.1%.
Poverty Correlation Summary
| Measurement | Immigrants from Jordan | Immigrants from Czechoslovakia |
| Minimum | 1.8% | 1.9% |
| Maximum | 52.2% | 30.2% |
| Range | 50.4% | 28.3% |
| Mean | 12.0% | 10.4% |
| Median | 10.5% | 9.1% |
| Interquartile 25% (IQ1) | 8.1% | 7.1% |
| Interquartile 75% (IQ3) | 13.8% | 12.4% |
| Interquartile Range (IQR) | 5.6% | 5.3% |
| Standard Deviation (Sample) | 7.2% | 5.6% |
| Standard Deviation (Population) | 7.1% | 5.6% |
Similar Demographics by Poverty
Demographics Similar to Immigrants from Jordan by Poverty
In terms of poverty, the demographic groups most similar to Immigrants from Jordan are Pakistani (11.9%, a difference of 0.030%), Immigrants from Switzerland (11.8%, a difference of 0.11%), Immigrants from Peru (11.9%, a difference of 0.22%), Immigrants from France (11.9%, a difference of 0.31%), and Chilean (11.8%, a difference of 0.32%).
| Demographics | Rating | Rank | Poverty |
| French | 86.1 /100 | #131 | Excellent 11.8% |
| Peruvians | 85.6 /100 | #132 | Excellent 11.8% |
| Immigrants | Western Europe | 85.2 /100 | #133 | Excellent 11.8% |
| Yugoslavians | 85.2 /100 | #134 | Excellent 11.8% |
| Immigrants | Vietnam | 85.2 /100 | #135 | Excellent 11.8% |
| Chileans | 84.2 /100 | #136 | Excellent 11.8% |
| Immigrants | Switzerland | 83.0 /100 | #137 | Excellent 11.8% |
| Immigrants | Jordan | 82.4 /100 | #138 | Excellent 11.9% |
| Pakistanis | 82.2 /100 | #139 | Excellent 11.9% |
| Immigrants | Peru | 81.1 /100 | #140 | Excellent 11.9% |
| Immigrants | France | 80.5 /100 | #141 | Excellent 11.9% |
| Basques | 80.4 /100 | #142 | Excellent 11.9% |
| Brazilians | 79.7 /100 | #143 | Good 11.9% |
| Icelanders | 77.9 /100 | #144 | Good 11.9% |
| Syrians | 75.1 /100 | #145 | Good 12.0% |
Demographics Similar to Immigrants from Czechoslovakia by Poverty
In terms of poverty, the demographic groups most similar to Immigrants from Czechoslovakia are Immigrants from Romania (11.0%, a difference of 0.010%), Slovene (11.0%, a difference of 0.060%), Immigrants from Japan (11.0%, a difference of 0.070%), Turkish (11.0%, a difference of 0.080%), and Asian (11.0%, a difference of 0.10%).
| Demographics | Rating | Rank | Poverty |
| Immigrants | Pakistan | 99.3 /100 | #39 | Exceptional 10.8% |
| Russians | 99.3 /100 | #40 | Exceptional 10.9% |
| Immigrants | Iran | 99.2 /100 | #41 | Exceptional 10.9% |
| Koreans | 99.2 /100 | #42 | Exceptional 10.9% |
| Immigrants | Singapore | 99.2 /100 | #43 | Exceptional 10.9% |
| Immigrants | Moldova | 99.1 /100 | #44 | Exceptional 10.9% |
| Turks | 98.9 /100 | #45 | Exceptional 11.0% |
| Immigrants | Czechoslovakia | 98.9 /100 | #46 | Exceptional 11.0% |
| Immigrants | Romania | 98.9 /100 | #47 | Exceptional 11.0% |
| Slovenes | 98.9 /100 | #48 | Exceptional 11.0% |
| Immigrants | Japan | 98.9 /100 | #49 | Exceptional 11.0% |
| Asians | 98.9 /100 | #50 | Exceptional 11.0% |
| Immigrants | Croatia | 98.7 /100 | #51 | Exceptional 11.0% |
| Immigrants | Philippines | 98.7 /100 | #52 | Exceptional 11.0% |
| Immigrants | Austria | 98.6 /100 | #53 | Exceptional 11.1% |