Immigrants from Jordan vs Hungarian Poverty
COMPARE
Immigrants from Jordan
Hungarian
Poverty
Poverty Comparison
Immigrants from Jordan
Hungarians
11.9%
POVERTY
82.4/ 100
METRIC RATING
138th/ 347
METRIC RANK
12.2%
POVERTY
63.6/ 100
METRIC RATING
155th/ 347
METRIC RANK
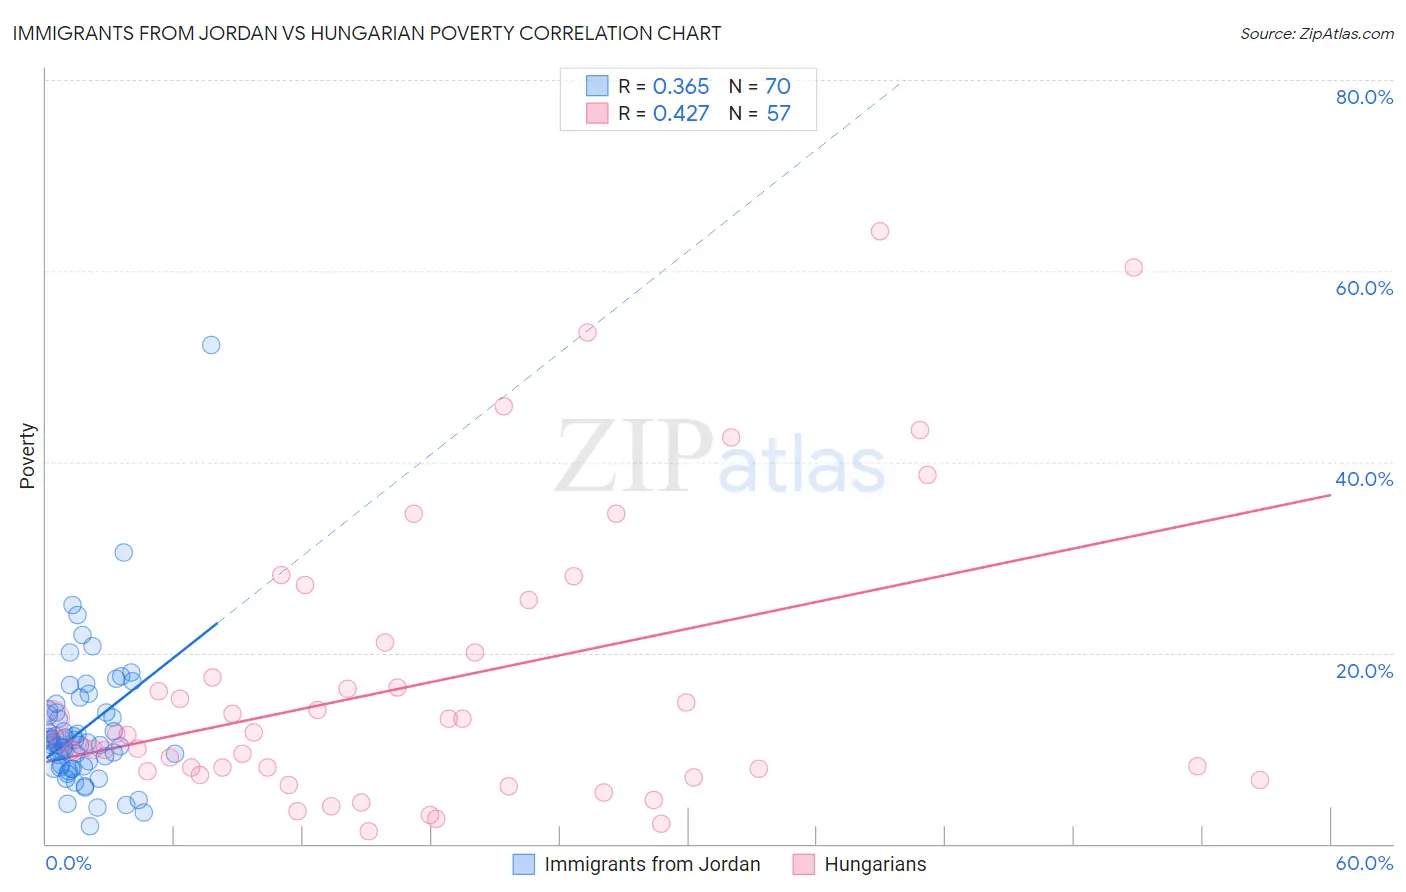
Immigrants from Jordan vs Hungarian Poverty Correlation Chart
The statistical analysis conducted on geographies consisting of 181,257,123 people shows a mild positive correlation between the proportion of Immigrants from Jordan and poverty level in the United States with a correlation coefficient (R) of 0.365 and weighted average of 11.9%. Similarly, the statistical analysis conducted on geographies consisting of 485,863,259 people shows a moderate positive correlation between the proportion of Hungarians and poverty level in the United States with a correlation coefficient (R) of 0.427 and weighted average of 12.2%, a difference of 2.5%.
Poverty Correlation Summary
| Measurement | Immigrants from Jordan | Hungarian |
| Minimum | 1.8% | 1.3% |
| Maximum | 52.2% | 64.2% |
| Range | 50.4% | 62.9% |
| Mean | 12.0% | 16.8% |
| Median | 10.5% | 11.3% |
| Interquartile 25% (IQ1) | 8.1% | 7.4% |
| Interquartile 75% (IQ3) | 13.8% | 20.5% |
| Interquartile Range (IQR) | 5.6% | 13.1% |
| Standard Deviation (Sample) | 7.2% | 14.9% |
| Standard Deviation (Population) | 7.1% | 14.8% |
Demographics Similar to Immigrants from Jordan and Hungarians by Poverty
In terms of poverty, the demographic groups most similar to Immigrants from Jordan are Pakistani (11.9%, a difference of 0.030%), Immigrants from Switzerland (11.8%, a difference of 0.11%), Immigrants from Peru (11.9%, a difference of 0.22%), Immigrants from France (11.9%, a difference of 0.31%), and Chilean (11.8%, a difference of 0.32%). Similarly, the demographic groups most similar to Hungarians are Guamanian/Chamorro (12.1%, a difference of 0.020%), Immigrants from Northern Africa (12.1%, a difference of 0.030%), Scotch-Irish (12.2%, a difference of 0.11%), Armenian (12.1%, a difference of 0.44%), and Samoan (12.0%, a difference of 0.94%).
| Demographics | Rating | Rank | Poverty |
| Chileans | 84.2 /100 | #136 | Excellent 11.8% |
| Immigrants | Switzerland | 83.0 /100 | #137 | Excellent 11.8% |
| Immigrants | Jordan | 82.4 /100 | #138 | Excellent 11.9% |
| Pakistanis | 82.2 /100 | #139 | Excellent 11.9% |
| Immigrants | Peru | 81.1 /100 | #140 | Excellent 11.9% |
| Immigrants | France | 80.5 /100 | #141 | Excellent 11.9% |
| Basques | 80.4 /100 | #142 | Excellent 11.9% |
| Brazilians | 79.7 /100 | #143 | Good 11.9% |
| Icelanders | 77.9 /100 | #144 | Good 11.9% |
| Syrians | 75.1 /100 | #145 | Good 12.0% |
| Afghans | 74.9 /100 | #146 | Good 12.0% |
| Immigrants | Bosnia and Herzegovina | 73.7 /100 | #147 | Good 12.0% |
| Immigrants | Germany | 72.7 /100 | #148 | Good 12.0% |
| Immigrants | Malaysia | 72.7 /100 | #149 | Good 12.0% |
| Immigrants | Kazakhstan | 72.3 /100 | #150 | Good 12.0% |
| Samoans | 71.9 /100 | #151 | Good 12.0% |
| Armenians | 67.6 /100 | #152 | Good 12.1% |
| Immigrants | Northern Africa | 63.9 /100 | #153 | Good 12.1% |
| Guamanians/Chamorros | 63.9 /100 | #154 | Good 12.1% |
| Hungarians | 63.6 /100 | #155 | Good 12.2% |
| Scotch-Irish | 62.6 /100 | #156 | Good 12.2% |