Soviet Union vs Immigrants from Czechoslovakia Poverty
COMPARE
Soviet Union
Immigrants from Czechoslovakia
Poverty
Poverty Comparison
Soviet Union
Immigrants from Czechoslovakia
11.7%
POVERTY
88.4/ 100
METRIC RATING
124th/ 347
METRIC RANK
11.0%
POVERTY
98.9/ 100
METRIC RATING
46th/ 347
METRIC RANK
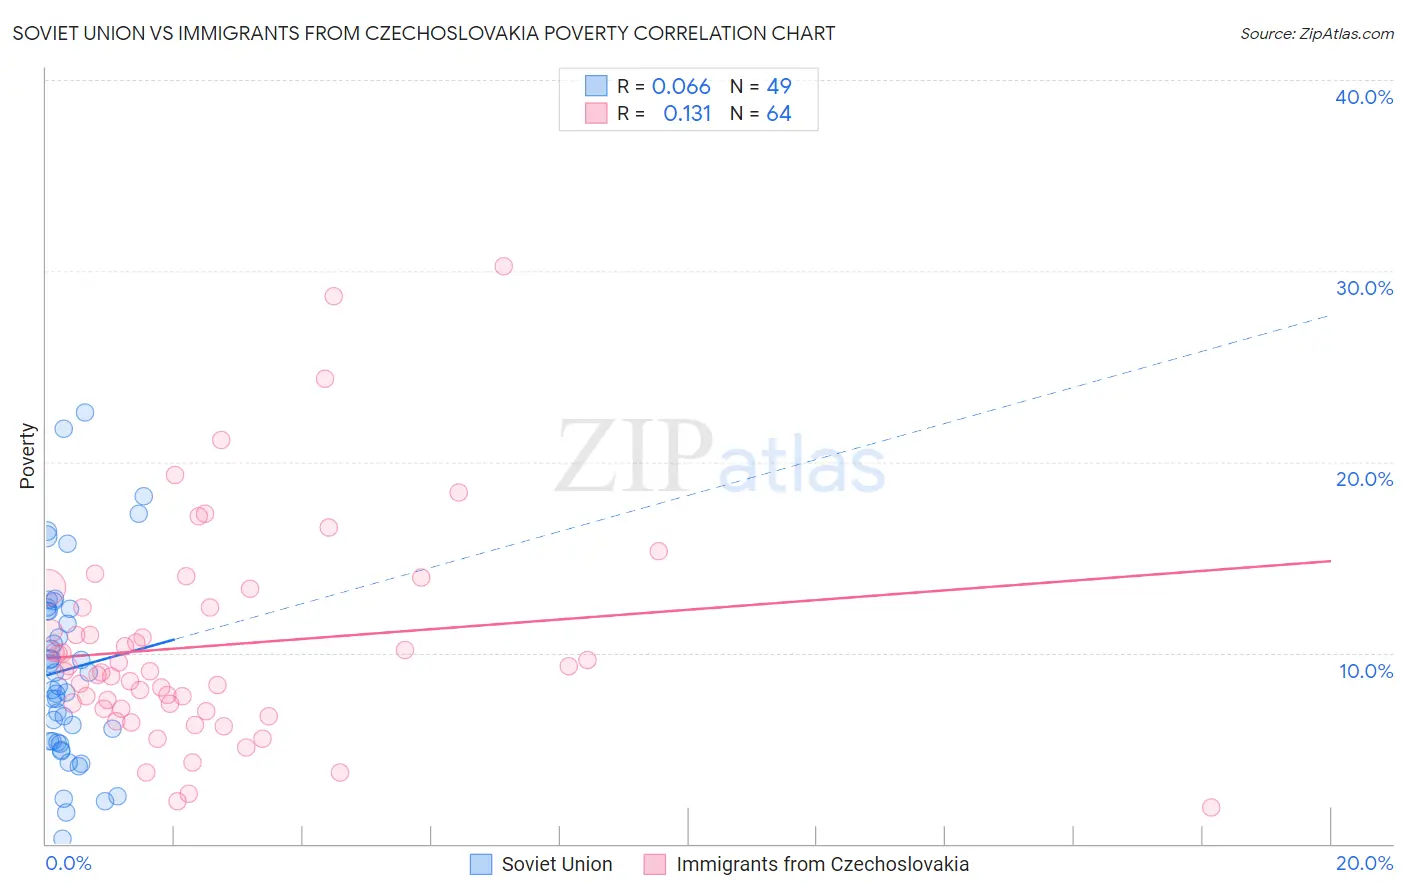
Soviet Union vs Immigrants from Czechoslovakia Poverty Correlation Chart
The statistical analysis conducted on geographies consisting of 43,449,399 people shows a slight positive correlation between the proportion of Soviet Union and poverty level in the United States with a correlation coefficient (R) of 0.066 and weighted average of 11.7%. Similarly, the statistical analysis conducted on geographies consisting of 195,452,968 people shows a poor positive correlation between the proportion of Immigrants from Czechoslovakia and poverty level in the United States with a correlation coefficient (R) of 0.131 and weighted average of 11.0%, a difference of 6.8%.
Poverty Correlation Summary
| Measurement | Soviet Union | Immigrants from Czechoslovakia |
| Minimum | 0.29% | 1.9% |
| Maximum | 22.6% | 30.2% |
| Range | 22.3% | 28.3% |
| Mean | 9.1% | 10.4% |
| Median | 8.3% | 9.1% |
| Interquartile 25% (IQ1) | 5.3% | 7.1% |
| Interquartile 75% (IQ3) | 12.3% | 12.4% |
| Interquartile Range (IQR) | 6.9% | 5.3% |
| Standard Deviation (Sample) | 5.0% | 5.6% |
| Standard Deviation (Population) | 5.0% | 5.6% |
Similar Demographics by Poverty
Demographics Similar to Soviet Union by Poverty
In terms of poverty, the demographic groups most similar to Soviet Union are Immigrants from Brazil (11.7%, a difference of 0.040%), Immigrants from Hungary (11.7%, a difference of 0.070%), Immigrants from Norway (11.7%, a difference of 0.080%), New Zealander (11.7%, a difference of 0.090%), and Puget Sound Salish (11.7%, a difference of 0.090%).
| Demographics | Rating | Rank | Poverty |
| Sri Lankans | 89.4 /100 | #117 | Excellent 11.7% |
| Argentineans | 89.1 /100 | #118 | Excellent 11.7% |
| Tlingit-Haida | 89.0 /100 | #119 | Excellent 11.7% |
| Immigrants | South Eastern Asia | 88.9 /100 | #120 | Excellent 11.7% |
| New Zealanders | 88.7 /100 | #121 | Excellent 11.7% |
| Puget Sound Salish | 88.7 /100 | #122 | Excellent 11.7% |
| Immigrants | Hungary | 88.6 /100 | #123 | Excellent 11.7% |
| Soviet Union | 88.4 /100 | #124 | Excellent 11.7% |
| Immigrants | Brazil | 88.2 /100 | #125 | Excellent 11.7% |
| Immigrants | Norway | 88.0 /100 | #126 | Excellent 11.7% |
| Immigrants | Argentina | 88.0 /100 | #127 | Excellent 11.7% |
| Immigrants | Israel | 87.4 /100 | #128 | Excellent 11.7% |
| South Africans | 87.0 /100 | #129 | Excellent 11.7% |
| Immigrants | Ukraine | 86.6 /100 | #130 | Excellent 11.8% |
| French | 86.1 /100 | #131 | Excellent 11.8% |
Demographics Similar to Immigrants from Czechoslovakia by Poverty
In terms of poverty, the demographic groups most similar to Immigrants from Czechoslovakia are Immigrants from Romania (11.0%, a difference of 0.010%), Slovene (11.0%, a difference of 0.060%), Immigrants from Japan (11.0%, a difference of 0.070%), Turkish (11.0%, a difference of 0.080%), and Asian (11.0%, a difference of 0.10%).
| Demographics | Rating | Rank | Poverty |
| Immigrants | Pakistan | 99.3 /100 | #39 | Exceptional 10.8% |
| Russians | 99.3 /100 | #40 | Exceptional 10.9% |
| Immigrants | Iran | 99.2 /100 | #41 | Exceptional 10.9% |
| Koreans | 99.2 /100 | #42 | Exceptional 10.9% |
| Immigrants | Singapore | 99.2 /100 | #43 | Exceptional 10.9% |
| Immigrants | Moldova | 99.1 /100 | #44 | Exceptional 10.9% |
| Turks | 98.9 /100 | #45 | Exceptional 11.0% |
| Immigrants | Czechoslovakia | 98.9 /100 | #46 | Exceptional 11.0% |
| Immigrants | Romania | 98.9 /100 | #47 | Exceptional 11.0% |
| Slovenes | 98.9 /100 | #48 | Exceptional 11.0% |
| Immigrants | Japan | 98.9 /100 | #49 | Exceptional 11.0% |
| Asians | 98.9 /100 | #50 | Exceptional 11.0% |
| Immigrants | Croatia | 98.7 /100 | #51 | Exceptional 11.0% |
| Immigrants | Philippines | 98.7 /100 | #52 | Exceptional 11.0% |
| Immigrants | Austria | 98.6 /100 | #53 | Exceptional 11.1% |