Immigrants from Jordan vs Immigrants from Czechoslovakia Bachelor's Degree
COMPARE
Immigrants from Jordan
Immigrants from Czechoslovakia
Bachelor's Degree
Bachelor's Degree Comparison
Immigrants from Jordan
Immigrants from Czechoslovakia
40.3%
BACHELOR'S DEGREE
93.4/ 100
METRIC RATING
127th/ 347
METRIC RANK
44.0%
BACHELOR'S DEGREE
99.9/ 100
METRIC RATING
58th/ 347
METRIC RANK
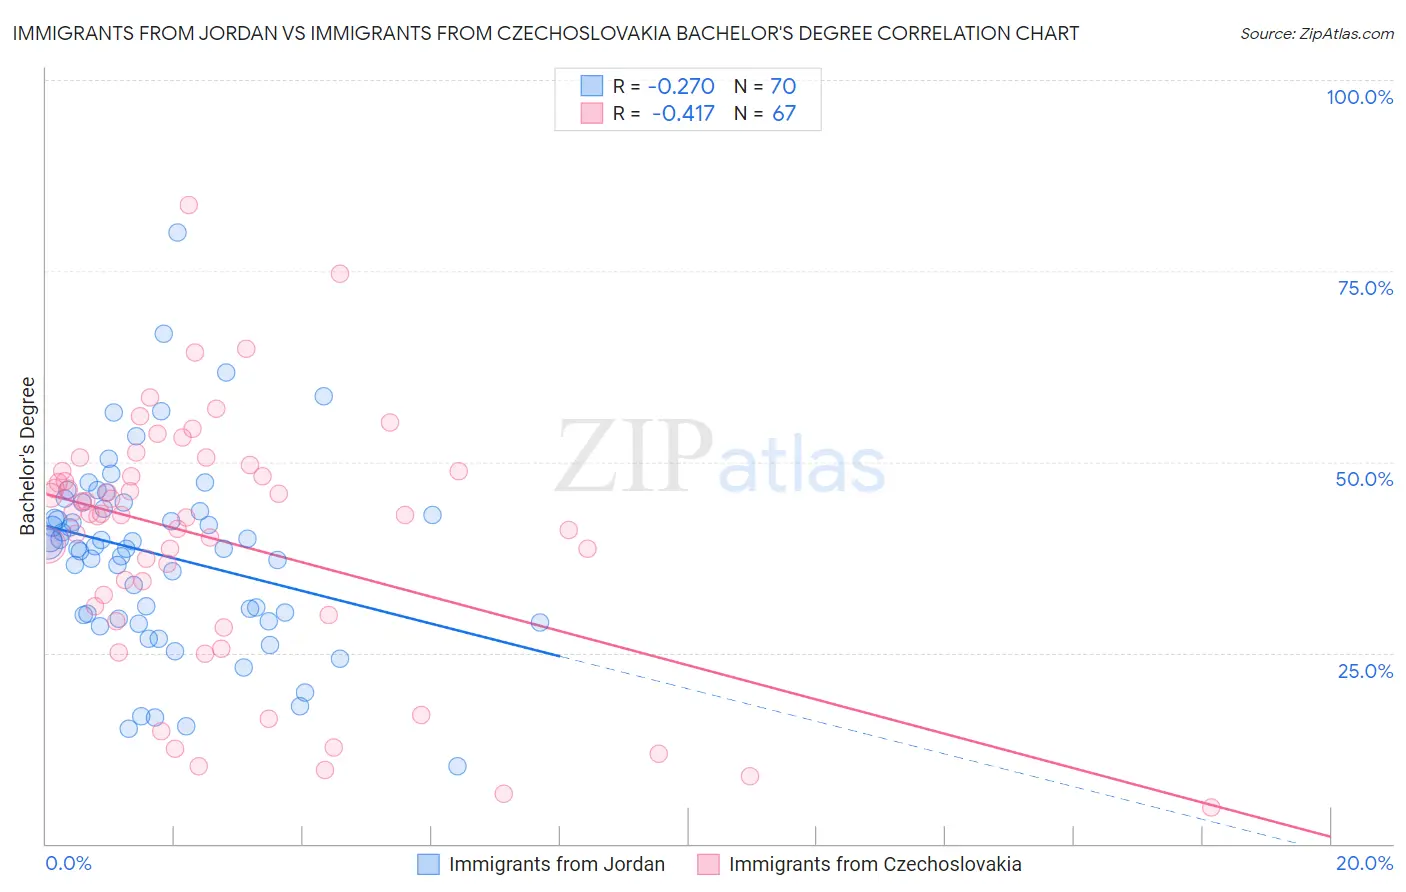
Immigrants from Jordan vs Immigrants from Czechoslovakia Bachelor's Degree Correlation Chart
The statistical analysis conducted on geographies consisting of 181,275,733 people shows a weak negative correlation between the proportion of Immigrants from Jordan and percentage of population with at least bachelor's degree education in the United States with a correlation coefficient (R) of -0.270 and weighted average of 40.3%. Similarly, the statistical analysis conducted on geographies consisting of 195,448,477 people shows a moderate negative correlation between the proportion of Immigrants from Czechoslovakia and percentage of population with at least bachelor's degree education in the United States with a correlation coefficient (R) of -0.417 and weighted average of 44.0%, a difference of 9.3%.
Bachelor's Degree Correlation Summary
| Measurement | Immigrants from Jordan | Immigrants from Czechoslovakia |
| Minimum | 10.2% | 4.8% |
| Maximum | 80.0% | 83.6% |
| Range | 69.8% | 78.9% |
| Mean | 37.8% | 39.6% |
| Median | 38.8% | 43.1% |
| Interquartile 25% (IQ1) | 29.5% | 29.9% |
| Interquartile 75% (IQ3) | 43.8% | 48.7% |
| Interquartile Range (IQR) | 14.3% | 18.8% |
| Standard Deviation (Sample) | 12.4% | 16.3% |
| Standard Deviation (Population) | 12.4% | 16.2% |
Similar Demographics by Bachelor's Degree
Demographics Similar to Immigrants from Jordan by Bachelor's Degree
In terms of bachelor's degree, the demographic groups most similar to Immigrants from Jordan are Immigrants from Venezuela (40.2%, a difference of 0.17%), Immigrants from Eastern Africa (40.4%, a difference of 0.28%), British (40.4%, a difference of 0.33%), Serbian (40.1%, a difference of 0.35%), and Immigrants from Eritrea (40.4%, a difference of 0.36%).
| Demographics | Rating | Rank | Bachelor's Degree |
| Venezuelans | 94.7 /100 | #120 | Exceptional 40.5% |
| Moroccans | 94.6 /100 | #121 | Exceptional 40.5% |
| Immigrants | Albania | 94.4 /100 | #122 | Exceptional 40.4% |
| Lebanese | 94.3 /100 | #123 | Exceptional 40.4% |
| Immigrants | Eritrea | 94.3 /100 | #124 | Exceptional 40.4% |
| British | 94.2 /100 | #125 | Exceptional 40.4% |
| Immigrants | Eastern Africa | 94.1 /100 | #126 | Exceptional 40.4% |
| Immigrants | Jordan | 93.4 /100 | #127 | Exceptional 40.3% |
| Immigrants | Venezuela | 92.9 /100 | #128 | Exceptional 40.2% |
| Serbians | 92.4 /100 | #129 | Exceptional 40.1% |
| Sierra Leoneans | 92.2 /100 | #130 | Exceptional 40.1% |
| Italians | 91.9 /100 | #131 | Exceptional 40.1% |
| Taiwanese | 91.1 /100 | #132 | Exceptional 40.0% |
| Immigrants | Southern Europe | 91.1 /100 | #133 | Exceptional 40.0% |
| Assyrians/Chaldeans/Syriacs | 89.4 /100 | #134 | Excellent 39.8% |
Demographics Similar to Immigrants from Czechoslovakia by Bachelor's Degree
In terms of bachelor's degree, the demographic groups most similar to Immigrants from Czechoslovakia are Paraguayan (44.0%, a difference of 0.050%), Australian (44.0%, a difference of 0.10%), New Zealander (44.0%, a difference of 0.11%), Immigrants from Serbia (44.1%, a difference of 0.24%), and Immigrants from Bolivia (44.2%, a difference of 0.42%).
| Demographics | Rating | Rank | Bachelor's Degree |
| Asians | 99.9 /100 | #51 | Exceptional 44.4% |
| Immigrants | Spain | 99.9 /100 | #52 | Exceptional 44.3% |
| Immigrants | Asia | 99.9 /100 | #53 | Exceptional 44.3% |
| Immigrants | Austria | 99.9 /100 | #54 | Exceptional 44.2% |
| Immigrants | Bolivia | 99.9 /100 | #55 | Exceptional 44.2% |
| Immigrants | Serbia | 99.9 /100 | #56 | Exceptional 44.1% |
| Paraguayans | 99.9 /100 | #57 | Exceptional 44.0% |
| Immigrants | Czechoslovakia | 99.9 /100 | #58 | Exceptional 44.0% |
| Australians | 99.9 /100 | #59 | Exceptional 44.0% |
| New Zealanders | 99.9 /100 | #60 | Exceptional 44.0% |
| South Africans | 99.8 /100 | #61 | Exceptional 43.6% |
| Immigrants | Kazakhstan | 99.8 /100 | #62 | Exceptional 43.4% |
| Immigrants | Europe | 99.8 /100 | #63 | Exceptional 43.4% |
| Argentineans | 99.7 /100 | #64 | Exceptional 43.3% |
| Zimbabweans | 99.7 /100 | #65 | Exceptional 43.3% |