Ugandan vs Immigrants from Czechoslovakia Poverty
COMPARE
Ugandan
Immigrants from Czechoslovakia
Poverty
Poverty Comparison
Ugandans
Immigrants from Czechoslovakia
13.1%
POVERTY
6.2/ 100
METRIC RATING
208th/ 347
METRIC RANK
11.0%
POVERTY
98.9/ 100
METRIC RATING
46th/ 347
METRIC RANK
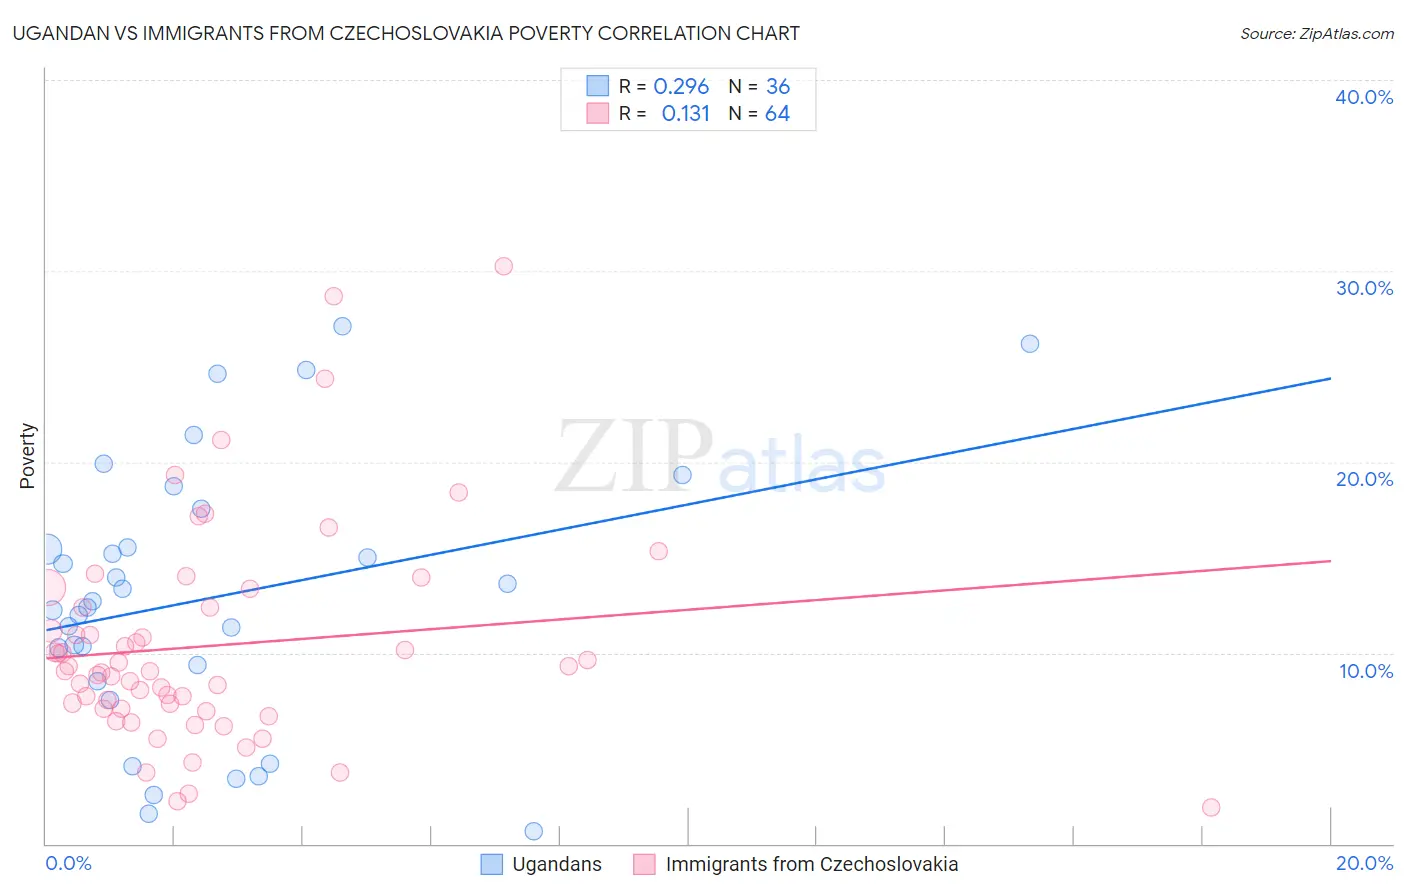
Ugandan vs Immigrants from Czechoslovakia Poverty Correlation Chart
The statistical analysis conducted on geographies consisting of 93,996,476 people shows a weak positive correlation between the proportion of Ugandans and poverty level in the United States with a correlation coefficient (R) of 0.296 and weighted average of 13.1%. Similarly, the statistical analysis conducted on geographies consisting of 195,452,968 people shows a poor positive correlation between the proportion of Immigrants from Czechoslovakia and poverty level in the United States with a correlation coefficient (R) of 0.131 and weighted average of 11.0%, a difference of 19.7%.
Poverty Correlation Summary
| Measurement | Ugandan | Immigrants from Czechoslovakia |
| Minimum | 0.63% | 1.9% |
| Maximum | 27.1% | 30.2% |
| Range | 26.5% | 28.3% |
| Mean | 12.9% | 10.4% |
| Median | 12.5% | 9.1% |
| Interquartile 25% (IQ1) | 8.9% | 7.1% |
| Interquartile 75% (IQ3) | 16.5% | 12.4% |
| Interquartile Range (IQR) | 7.6% | 5.3% |
| Standard Deviation (Sample) | 7.0% | 5.6% |
| Standard Deviation (Population) | 6.9% | 5.6% |
Similar Demographics by Poverty
Demographics Similar to Ugandans by Poverty
In terms of poverty, the demographic groups most similar to Ugandans are Malaysian (13.1%, a difference of 0.030%), Immigrants from the Azores (13.1%, a difference of 0.060%), Panamanian (13.1%, a difference of 0.15%), Immigrants from Eastern Africa (13.1%, a difference of 0.27%), and Moroccan (13.2%, a difference of 0.42%).
| Demographics | Rating | Rank | Poverty |
| Immigrants | Uganda | 16.5 /100 | #201 | Poor 12.8% |
| Immigrants | Uruguay | 15.6 /100 | #202 | Poor 12.8% |
| Hmong | 15.0 /100 | #203 | Poor 12.8% |
| Immigrants | Western Asia | 14.1 /100 | #204 | Poor 12.9% |
| Tsimshian | 9.2 /100 | #205 | Tragic 13.0% |
| Immigrants | Eastern Africa | 7.0 /100 | #206 | Tragic 13.1% |
| Panamanians | 6.6 /100 | #207 | Tragic 13.1% |
| Ugandans | 6.2 /100 | #208 | Tragic 13.1% |
| Malaysians | 6.1 /100 | #209 | Tragic 13.1% |
| Immigrants | Azores | 6.1 /100 | #210 | Tragic 13.1% |
| Moroccans | 5.2 /100 | #211 | Tragic 13.2% |
| Immigrants | Immigrants | 4.3 /100 | #212 | Tragic 13.2% |
| Immigrants | Panama | 4.1 /100 | #213 | Tragic 13.3% |
| Bermudans | 3.7 /100 | #214 | Tragic 13.3% |
| Japanese | 3.3 /100 | #215 | Tragic 13.3% |
Demographics Similar to Immigrants from Czechoslovakia by Poverty
In terms of poverty, the demographic groups most similar to Immigrants from Czechoslovakia are Immigrants from Romania (11.0%, a difference of 0.010%), Slovene (11.0%, a difference of 0.060%), Immigrants from Japan (11.0%, a difference of 0.070%), Turkish (11.0%, a difference of 0.080%), and Asian (11.0%, a difference of 0.10%).
| Demographics | Rating | Rank | Poverty |
| Immigrants | Pakistan | 99.3 /100 | #39 | Exceptional 10.8% |
| Russians | 99.3 /100 | #40 | Exceptional 10.9% |
| Immigrants | Iran | 99.2 /100 | #41 | Exceptional 10.9% |
| Koreans | 99.2 /100 | #42 | Exceptional 10.9% |
| Immigrants | Singapore | 99.2 /100 | #43 | Exceptional 10.9% |
| Immigrants | Moldova | 99.1 /100 | #44 | Exceptional 10.9% |
| Turks | 98.9 /100 | #45 | Exceptional 11.0% |
| Immigrants | Czechoslovakia | 98.9 /100 | #46 | Exceptional 11.0% |
| Immigrants | Romania | 98.9 /100 | #47 | Exceptional 11.0% |
| Slovenes | 98.9 /100 | #48 | Exceptional 11.0% |
| Immigrants | Japan | 98.9 /100 | #49 | Exceptional 11.0% |
| Asians | 98.9 /100 | #50 | Exceptional 11.0% |
| Immigrants | Croatia | 98.7 /100 | #51 | Exceptional 11.0% |
| Immigrants | Philippines | 98.7 /100 | #52 | Exceptional 11.0% |
| Immigrants | Austria | 98.6 /100 | #53 | Exceptional 11.1% |