Immigrants from Iran vs Guyanese Single Female Poverty
COMPARE
Immigrants from Iran
Guyanese
Single Female Poverty
Single Female Poverty Comparison
Immigrants from Iran
Guyanese
17.5%
SINGLE FEMALE POVERTY
100.0/ 100
METRIC RATING
8th/ 347
METRIC RANK
21.0%
SINGLE FEMALE POVERTY
52.0/ 100
METRIC RATING
172nd/ 347
METRIC RANK
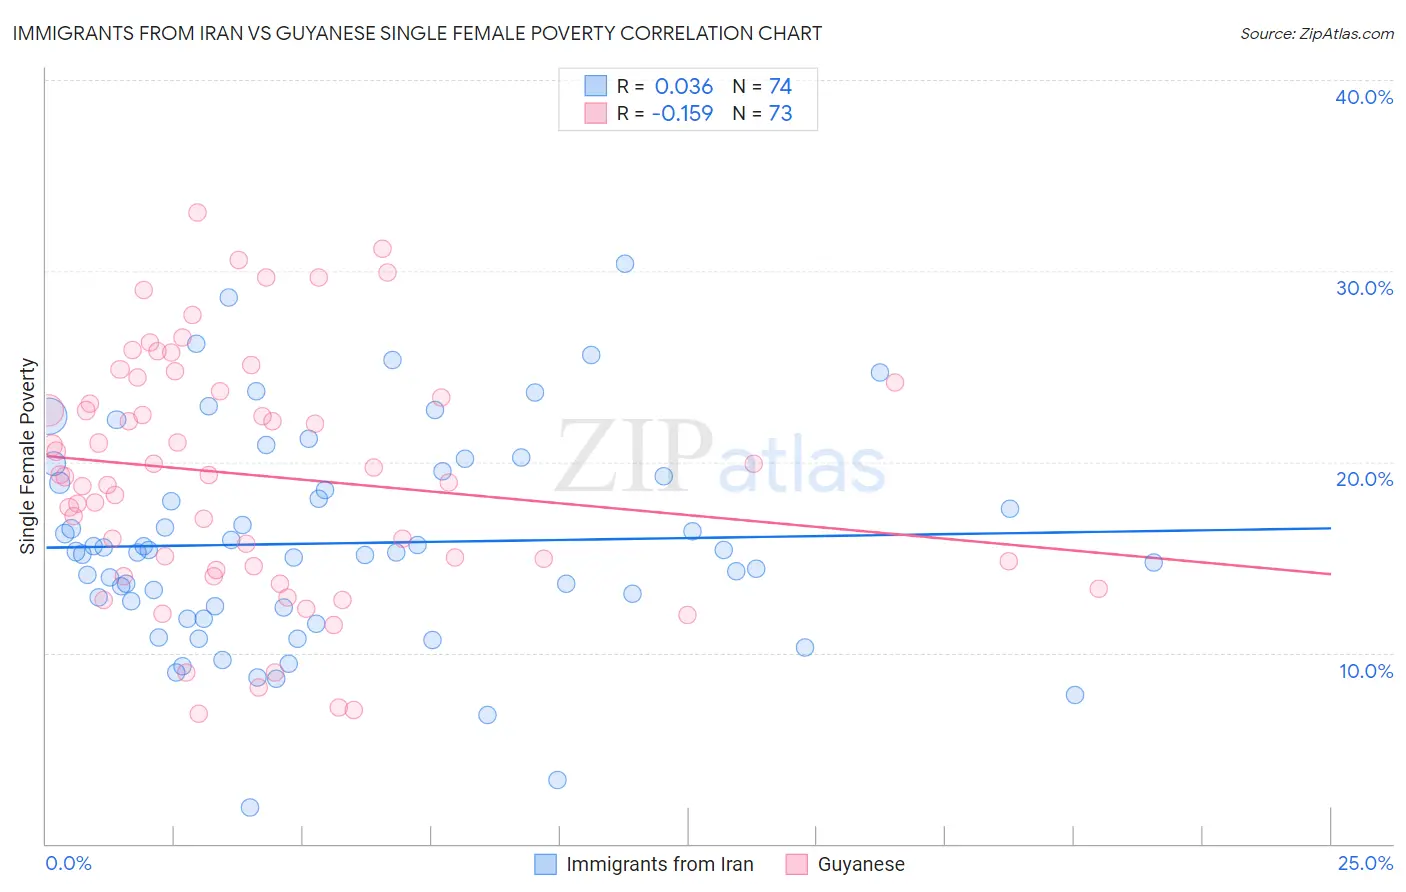
Immigrants from Iran vs Guyanese Single Female Poverty Correlation Chart
The statistical analysis conducted on geographies consisting of 276,267,918 people shows no correlation between the proportion of Immigrants from Iran and poverty level among single females in the United States with a correlation coefficient (R) of 0.036 and weighted average of 17.5%. Similarly, the statistical analysis conducted on geographies consisting of 175,255,160 people shows a poor negative correlation between the proportion of Guyanese and poverty level among single females in the United States with a correlation coefficient (R) of -0.159 and weighted average of 21.0%, a difference of 20.2%.
Single Female Poverty Correlation Summary
| Measurement | Immigrants from Iran | Guyanese |
| Minimum | 1.9% | 6.8% |
| Maximum | 30.4% | 33.1% |
| Range | 28.5% | 26.2% |
| Mean | 15.7% | 19.3% |
| Median | 15.3% | 19.3% |
| Interquartile 25% (IQ1) | 12.3% | 14.4% |
| Interquartile 75% (IQ3) | 19.3% | 23.9% |
| Interquartile Range (IQR) | 6.9% | 9.5% |
| Standard Deviation (Sample) | 5.6% | 6.3% |
| Standard Deviation (Population) | 5.5% | 6.3% |
Similar Demographics by Single Female Poverty
Demographics Similar to Immigrants from Iran by Single Female Poverty
In terms of single female poverty, the demographic groups most similar to Immigrants from Iran are Thai (17.3%, a difference of 0.99%), Bhutanese (17.7%, a difference of 1.4%), Immigrants from Ireland (17.8%, a difference of 1.8%), Immigrants from Lithuania (17.8%, a difference of 1.9%), and Immigrants from South Central Asia (17.8%, a difference of 2.0%).
| Demographics | Rating | Rank | Single Female Poverty |
| Chinese | 100.0 /100 | #1 | Exceptional 16.1% |
| Immigrants | Taiwan | 100.0 /100 | #2 | Exceptional 16.4% |
| Immigrants | Hong Kong | 100.0 /100 | #3 | Exceptional 16.5% |
| Immigrants | India | 100.0 /100 | #4 | Exceptional 16.8% |
| Assyrians/Chaldeans/Syriacs | 100.0 /100 | #5 | Exceptional 17.0% |
| Filipinos | 100.0 /100 | #6 | Exceptional 17.0% |
| Thais | 100.0 /100 | #7 | Exceptional 17.3% |
| Immigrants | Iran | 100.0 /100 | #8 | Exceptional 17.5% |
| Bhutanese | 100.0 /100 | #9 | Exceptional 17.7% |
| Immigrants | Ireland | 100.0 /100 | #10 | Exceptional 17.8% |
| Immigrants | Lithuania | 100.0 /100 | #11 | Exceptional 17.8% |
| Immigrants | South Central Asia | 100.0 /100 | #12 | Exceptional 17.8% |
| Immigrants | Bolivia | 100.0 /100 | #13 | Exceptional 17.8% |
| Bolivians | 100.0 /100 | #14 | Exceptional 17.9% |
| Indians (Asian) | 100.0 /100 | #15 | Exceptional 17.9% |
Demographics Similar to Guyanese by Single Female Poverty
In terms of single female poverty, the demographic groups most similar to Guyanese are Moroccan (21.0%, a difference of 0.050%), New Zealander (21.0%, a difference of 0.070%), Immigrants from Guyana (21.0%, a difference of 0.090%), Cuban (21.0%, a difference of 0.13%), and Immigrants from Trinidad and Tobago (20.9%, a difference of 0.27%).
| Demographics | Rating | Rank | Single Female Poverty |
| Ugandans | 64.0 /100 | #165 | Good 20.8% |
| Norwegians | 63.0 /100 | #166 | Good 20.8% |
| Immigrants | Norway | 63.0 /100 | #167 | Good 20.8% |
| Immigrants | Costa Rica | 61.5 /100 | #168 | Good 20.9% |
| Immigrants | Trinidad and Tobago | 56.3 /100 | #169 | Average 20.9% |
| New Zealanders | 53.2 /100 | #170 | Average 21.0% |
| Moroccans | 52.8 /100 | #171 | Average 21.0% |
| Guyanese | 52.0 /100 | #172 | Average 21.0% |
| Immigrants | Guyana | 50.6 /100 | #173 | Average 21.0% |
| Cubans | 50.0 /100 | #174 | Average 21.0% |
| Czechs | 46.8 /100 | #175 | Average 21.0% |
| Canadians | 45.4 /100 | #176 | Average 21.1% |
| Scandinavians | 45.2 /100 | #177 | Average 21.1% |
| Immigrants | Bosnia and Herzegovina | 44.9 /100 | #178 | Average 21.1% |
| British | 42.9 /100 | #179 | Average 21.1% |