Immigrants from Iran vs Dutch West Indian Single Father Poverty
COMPARE
Immigrants from Iran
Dutch West Indian
Single Father Poverty
Single Father Poverty Comparison
Immigrants from Iran
Dutch West Indians
14.2%
SINGLE FATHER POVERTY
100.0/ 100
METRIC RATING
16th/ 347
METRIC RANK
19.2%
SINGLE FATHER POVERTY
0.0/ 100
METRIC RATING
318th/ 347
METRIC RANK
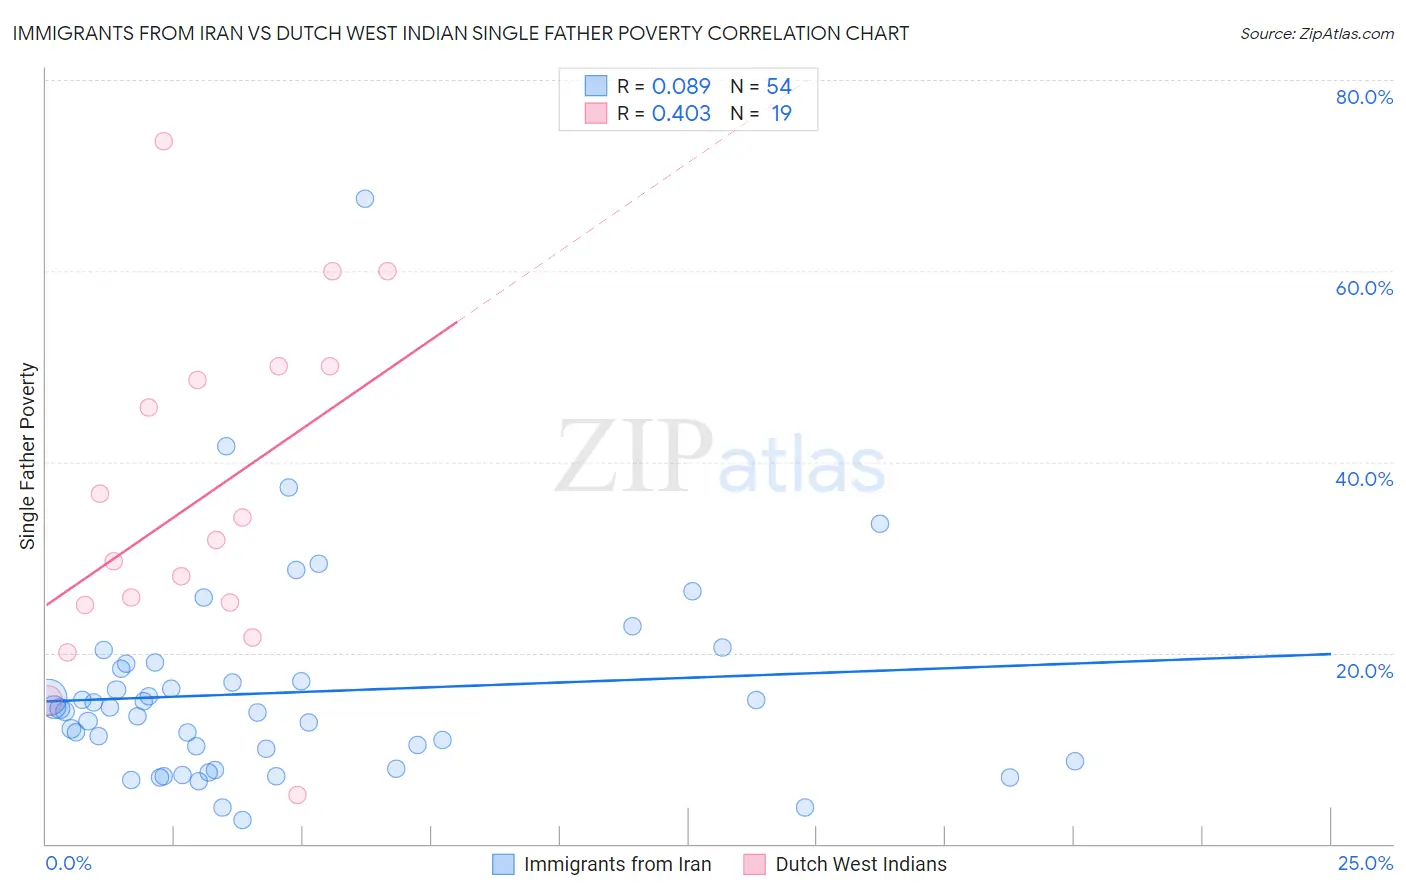
Immigrants from Iran vs Dutch West Indian Single Father Poverty Correlation Chart
The statistical analysis conducted on geographies consisting of 227,784,696 people shows a slight positive correlation between the proportion of Immigrants from Iran and poverty level among single fathers in the United States with a correlation coefficient (R) of 0.089 and weighted average of 14.2%. Similarly, the statistical analysis conducted on geographies consisting of 78,591,336 people shows a moderate positive correlation between the proportion of Dutch West Indians and poverty level among single fathers in the United States with a correlation coefficient (R) of 0.403 and weighted average of 19.2%, a difference of 35.4%.
Single Father Poverty Correlation Summary
| Measurement | Immigrants from Iran | Dutch West Indian |
| Minimum | 2.4% | 5.2% |
| Maximum | 67.6% | 73.5% |
| Range | 65.1% | 68.4% |
| Mean | 15.8% | 36.1% |
| Median | 14.0% | 31.8% |
| Interquartile 25% (IQ1) | 8.7% | 25.0% |
| Interquartile 75% (IQ3) | 18.3% | 50.0% |
| Interquartile Range (IQR) | 9.6% | 25.0% |
| Standard Deviation (Sample) | 10.9% | 17.5% |
| Standard Deviation (Population) | 10.8% | 17.1% |
Similar Demographics by Single Father Poverty
Demographics Similar to Immigrants from Iran by Single Father Poverty
In terms of single father poverty, the demographic groups most similar to Immigrants from Iran are Sri Lankan (14.2%, a difference of 0.20%), Immigrants from Vietnam (14.1%, a difference of 0.26%), Immigrants from Hong Kong (14.2%, a difference of 0.45%), Soviet Union (14.3%, a difference of 0.48%), and Immigrants from Iraq (14.3%, a difference of 0.52%).
| Demographics | Rating | Rank | Single Father Poverty |
| Afghans | 100.0 /100 | #9 | Exceptional 14.0% |
| Koreans | 100.0 /100 | #10 | Exceptional 14.0% |
| Filipinos | 100.0 /100 | #11 | Exceptional 14.0% |
| Immigrants | India | 100.0 /100 | #12 | Exceptional 14.0% |
| Immigrants | Philippines | 100.0 /100 | #13 | Exceptional 14.0% |
| Immigrants | Vietnam | 100.0 /100 | #14 | Exceptional 14.1% |
| Sri Lankans | 100.0 /100 | #15 | Exceptional 14.2% |
| Immigrants | Iran | 100.0 /100 | #16 | Exceptional 14.2% |
| Immigrants | Hong Kong | 100.0 /100 | #17 | Exceptional 14.2% |
| Soviet Union | 100.0 /100 | #18 | Exceptional 14.3% |
| Immigrants | Iraq | 100.0 /100 | #19 | Exceptional 14.3% |
| Immigrants | Singapore | 100.0 /100 | #20 | Exceptional 14.3% |
| Immigrants | Afghanistan | 100.0 /100 | #21 | Exceptional 14.3% |
| Taiwanese | 100.0 /100 | #22 | Exceptional 14.3% |
| Immigrants | Egypt | 100.0 /100 | #23 | Exceptional 14.4% |
Demographics Similar to Dutch West Indians by Single Father Poverty
In terms of single father poverty, the demographic groups most similar to Dutch West Indians are Slovak (19.3%, a difference of 0.52%), Dominican (19.1%, a difference of 0.58%), Osage (19.0%, a difference of 0.89%), Chickasaw (19.0%, a difference of 1.3%), and Inupiat (19.5%, a difference of 1.4%).
| Demographics | Rating | Rank | Single Father Poverty |
| Immigrants | Nonimmigrants | 0.0 /100 | #311 | Tragic 18.8% |
| Immigrants | Dominica | 0.0 /100 | #312 | Tragic 18.9% |
| Potawatomi | 0.0 /100 | #313 | Tragic 18.9% |
| Delaware | 0.0 /100 | #314 | Tragic 18.9% |
| Chickasaw | 0.0 /100 | #315 | Tragic 19.0% |
| Osage | 0.0 /100 | #316 | Tragic 19.0% |
| Dominicans | 0.0 /100 | #317 | Tragic 19.1% |
| Dutch West Indians | 0.0 /100 | #318 | Tragic 19.2% |
| Slovaks | 0.0 /100 | #319 | Tragic 19.3% |
| Inupiat | 0.0 /100 | #320 | Tragic 19.5% |
| Cherokee | 0.0 /100 | #321 | Tragic 19.6% |
| Creek | 0.0 /100 | #322 | Tragic 19.8% |
| Pennsylvania Germans | 0.0 /100 | #323 | Tragic 20.0% |
| Americans | 0.0 /100 | #324 | Tragic 20.1% |
| Blacks/African Americans | 0.0 /100 | #325 | Tragic 20.4% |