Immigrants from St. Vincent and the Grenadines vs Dutch West Indian Single Father Poverty
COMPARE
Immigrants from St. Vincent and the Grenadines
Dutch West Indian
Single Father Poverty
Single Father Poverty Comparison
Immigrants from St. Vincent and the Grenadines
Dutch West Indians
16.3%
SINGLE FATHER POVERTY
50.0/ 100
METRIC RATING
173rd/ 347
METRIC RANK
19.2%
SINGLE FATHER POVERTY
0.0/ 100
METRIC RATING
318th/ 347
METRIC RANK
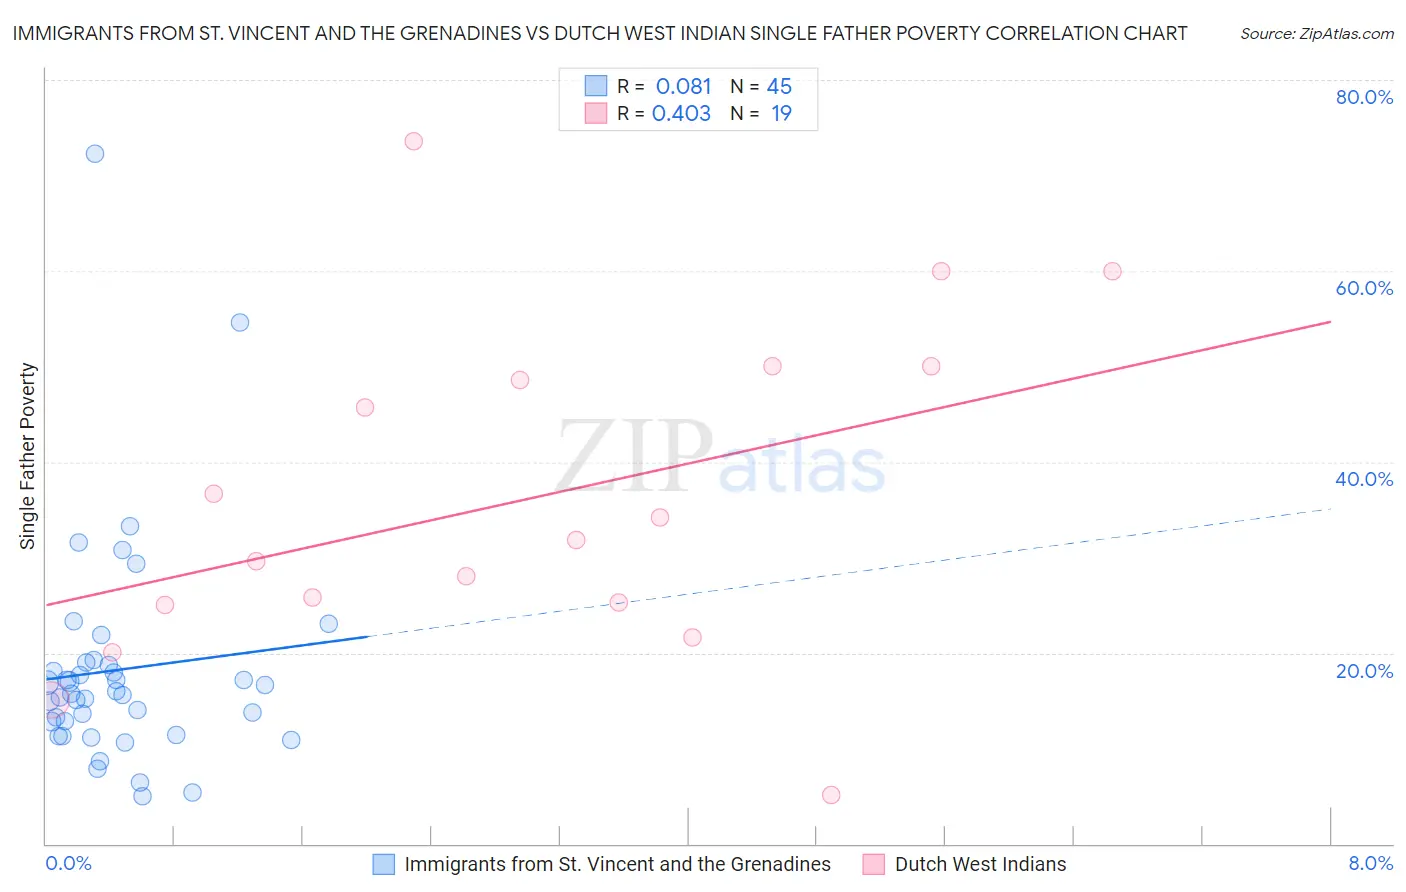
Immigrants from St. Vincent and the Grenadines vs Dutch West Indian Single Father Poverty Correlation Chart
The statistical analysis conducted on geographies consisting of 52,217,321 people shows a slight positive correlation between the proportion of Immigrants from St. Vincent and the Grenadines and poverty level among single fathers in the United States with a correlation coefficient (R) of 0.081 and weighted average of 16.3%. Similarly, the statistical analysis conducted on geographies consisting of 78,591,336 people shows a moderate positive correlation between the proportion of Dutch West Indians and poverty level among single fathers in the United States with a correlation coefficient (R) of 0.403 and weighted average of 19.2%, a difference of 17.8%.
Single Father Poverty Correlation Summary
| Measurement | Immigrants from St. Vincent and the Grenadines | Dutch West Indian |
| Minimum | 5.0% | 5.2% |
| Maximum | 72.3% | 73.5% |
| Range | 67.3% | 68.4% |
| Mean | 18.2% | 36.1% |
| Median | 15.8% | 31.8% |
| Interquartile 25% (IQ1) | 12.1% | 25.0% |
| Interquartile 75% (IQ3) | 18.9% | 50.0% |
| Interquartile Range (IQR) | 6.8% | 25.0% |
| Standard Deviation (Sample) | 11.9% | 17.5% |
| Standard Deviation (Population) | 11.7% | 17.1% |
Similar Demographics by Single Father Poverty
Demographics Similar to Immigrants from St. Vincent and the Grenadines by Single Father Poverty
In terms of single father poverty, the demographic groups most similar to Immigrants from St. Vincent and the Grenadines are Immigrants from Sierra Leone (16.3%, a difference of 0.0%), Swedish (16.3%, a difference of 0.0%), Immigrants from Ecuador (16.3%, a difference of 0.020%), Immigrants from Morocco (16.3%, a difference of 0.030%), and Vietnamese (16.3%, a difference of 0.090%).
| Demographics | Rating | Rank | Single Father Poverty |
| Immigrants | Europe | 54.8 /100 | #166 | Average 16.3% |
| Yugoslavians | 53.9 /100 | #167 | Average 16.3% |
| Costa Ricans | 53.6 /100 | #168 | Average 16.3% |
| Northern Europeans | 52.8 /100 | #169 | Average 16.3% |
| Scandinavians | 52.3 /100 | #170 | Average 16.3% |
| Immigrants | Morocco | 50.7 /100 | #171 | Average 16.3% |
| Immigrants | Sierra Leone | 50.1 /100 | #172 | Average 16.3% |
| Immigrants | St. Vincent and the Grenadines | 50.0 /100 | #173 | Average 16.3% |
| Swedes | 50.0 /100 | #174 | Average 16.3% |
| Immigrants | Ecuador | 49.7 /100 | #175 | Average 16.3% |
| Vietnamese | 48.0 /100 | #176 | Average 16.3% |
| Immigrants | South Africa | 44.2 /100 | #177 | Average 16.3% |
| Immigrants | Cuba | 41.6 /100 | #178 | Average 16.4% |
| Serbians | 40.9 /100 | #179 | Average 16.4% |
| Immigrants | Latin America | 37.2 /100 | #180 | Fair 16.4% |
Demographics Similar to Dutch West Indians by Single Father Poverty
In terms of single father poverty, the demographic groups most similar to Dutch West Indians are Slovak (19.3%, a difference of 0.52%), Dominican (19.1%, a difference of 0.58%), Osage (19.0%, a difference of 0.89%), Chickasaw (19.0%, a difference of 1.3%), and Inupiat (19.5%, a difference of 1.4%).
| Demographics | Rating | Rank | Single Father Poverty |
| Immigrants | Nonimmigrants | 0.0 /100 | #311 | Tragic 18.8% |
| Immigrants | Dominica | 0.0 /100 | #312 | Tragic 18.9% |
| Potawatomi | 0.0 /100 | #313 | Tragic 18.9% |
| Delaware | 0.0 /100 | #314 | Tragic 18.9% |
| Chickasaw | 0.0 /100 | #315 | Tragic 19.0% |
| Osage | 0.0 /100 | #316 | Tragic 19.0% |
| Dominicans | 0.0 /100 | #317 | Tragic 19.1% |
| Dutch West Indians | 0.0 /100 | #318 | Tragic 19.2% |
| Slovaks | 0.0 /100 | #319 | Tragic 19.3% |
| Inupiat | 0.0 /100 | #320 | Tragic 19.5% |
| Cherokee | 0.0 /100 | #321 | Tragic 19.6% |
| Creek | 0.0 /100 | #322 | Tragic 19.8% |
| Pennsylvania Germans | 0.0 /100 | #323 | Tragic 20.0% |
| Americans | 0.0 /100 | #324 | Tragic 20.1% |
| Blacks/African Americans | 0.0 /100 | #325 | Tragic 20.4% |