Immigrants from North Macedonia vs Dutch West Indian Single Father Poverty
COMPARE
Immigrants from North Macedonia
Dutch West Indian
Single Father Poverty
Single Father Poverty Comparison
Immigrants from North Macedonia
Dutch West Indians
17.9%
SINGLE FATHER POVERTY
0.0/ 100
METRIC RATING
286th/ 347
METRIC RANK
19.2%
SINGLE FATHER POVERTY
0.0/ 100
METRIC RATING
318th/ 347
METRIC RANK
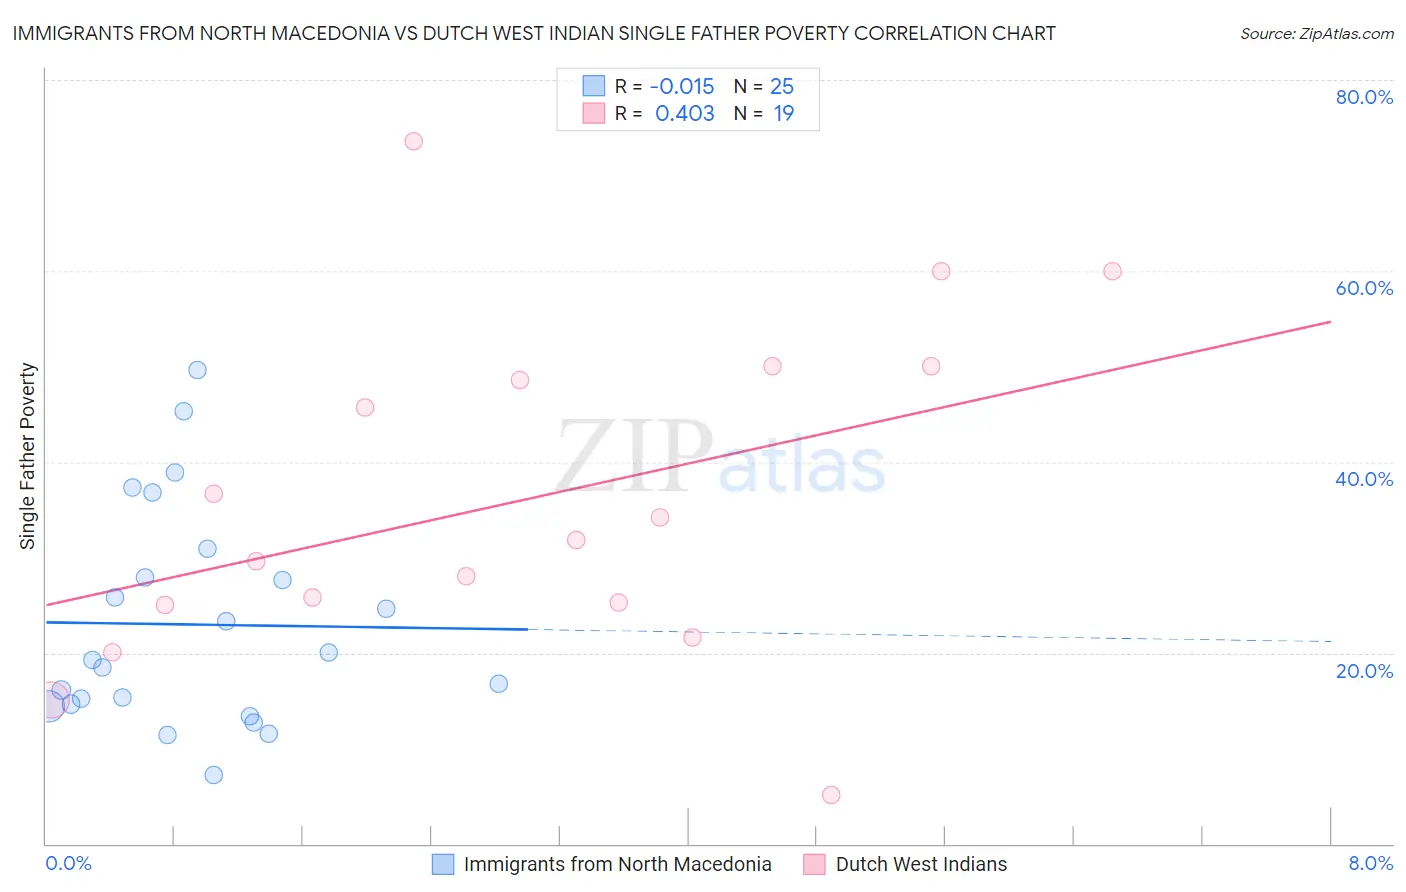
Immigrants from North Macedonia vs Dutch West Indian Single Father Poverty Correlation Chart
The statistical analysis conducted on geographies consisting of 65,204,585 people shows no correlation between the proportion of Immigrants from North Macedonia and poverty level among single fathers in the United States with a correlation coefficient (R) of -0.015 and weighted average of 17.9%. Similarly, the statistical analysis conducted on geographies consisting of 78,591,336 people shows a moderate positive correlation between the proportion of Dutch West Indians and poverty level among single fathers in the United States with a correlation coefficient (R) of 0.403 and weighted average of 19.2%, a difference of 7.1%.
Single Father Poverty Correlation Summary
| Measurement | Immigrants from North Macedonia | Dutch West Indian |
| Minimum | 7.1% | 5.2% |
| Maximum | 49.6% | 73.5% |
| Range | 42.5% | 68.4% |
| Mean | 23.0% | 36.1% |
| Median | 19.3% | 31.8% |
| Interquartile 25% (IQ1) | 14.5% | 25.0% |
| Interquartile 75% (IQ3) | 29.4% | 50.0% |
| Interquartile Range (IQR) | 14.9% | 25.0% |
| Standard Deviation (Sample) | 11.3% | 17.5% |
| Standard Deviation (Population) | 11.1% | 17.1% |
Similar Demographics by Single Father Poverty
Demographics Similar to Immigrants from North Macedonia by Single Father Poverty
In terms of single father poverty, the demographic groups most similar to Immigrants from North Macedonia are Immigrants from Lebanon (17.9%, a difference of 0.18%), Carpatho Rusyn (18.0%, a difference of 0.22%), Bahamian (18.0%, a difference of 0.25%), Welsh (17.8%, a difference of 0.55%), and Alsatian (17.8%, a difference of 0.56%).
| Demographics | Rating | Rank | Single Father Poverty |
| Iroquois | 0.0 /100 | #279 | Tragic 17.7% |
| Scottish | 0.0 /100 | #280 | Tragic 17.7% |
| English | 0.0 /100 | #281 | Tragic 17.8% |
| Dutch | 0.0 /100 | #282 | Tragic 17.8% |
| Alsatians | 0.0 /100 | #283 | Tragic 17.8% |
| Welsh | 0.0 /100 | #284 | Tragic 17.8% |
| Immigrants | Lebanon | 0.0 /100 | #285 | Tragic 17.9% |
| Immigrants | North Macedonia | 0.0 /100 | #286 | Tragic 17.9% |
| Carpatho Rusyns | 0.0 /100 | #287 | Tragic 18.0% |
| Bahamians | 0.0 /100 | #288 | Tragic 18.0% |
| Irish | 0.0 /100 | #289 | Tragic 18.0% |
| West Indians | 0.0 /100 | #290 | Tragic 18.0% |
| Alaskan Athabascans | 0.0 /100 | #291 | Tragic 18.1% |
| Immigrants | Bahamas | 0.0 /100 | #292 | Tragic 18.1% |
| Alaska Natives | 0.0 /100 | #293 | Tragic 18.1% |
Demographics Similar to Dutch West Indians by Single Father Poverty
In terms of single father poverty, the demographic groups most similar to Dutch West Indians are Slovak (19.3%, a difference of 0.52%), Dominican (19.1%, a difference of 0.58%), Osage (19.0%, a difference of 0.89%), Chickasaw (19.0%, a difference of 1.3%), and Inupiat (19.5%, a difference of 1.4%).
| Demographics | Rating | Rank | Single Father Poverty |
| Immigrants | Nonimmigrants | 0.0 /100 | #311 | Tragic 18.8% |
| Immigrants | Dominica | 0.0 /100 | #312 | Tragic 18.9% |
| Potawatomi | 0.0 /100 | #313 | Tragic 18.9% |
| Delaware | 0.0 /100 | #314 | Tragic 18.9% |
| Chickasaw | 0.0 /100 | #315 | Tragic 19.0% |
| Osage | 0.0 /100 | #316 | Tragic 19.0% |
| Dominicans | 0.0 /100 | #317 | Tragic 19.1% |
| Dutch West Indians | 0.0 /100 | #318 | Tragic 19.2% |
| Slovaks | 0.0 /100 | #319 | Tragic 19.3% |
| Inupiat | 0.0 /100 | #320 | Tragic 19.5% |
| Cherokee | 0.0 /100 | #321 | Tragic 19.6% |
| Creek | 0.0 /100 | #322 | Tragic 19.8% |
| Pennsylvania Germans | 0.0 /100 | #323 | Tragic 20.0% |
| Americans | 0.0 /100 | #324 | Tragic 20.1% |
| Blacks/African Americans | 0.0 /100 | #325 | Tragic 20.4% |