Immigrants from Iran vs Sudanese Poverty
COMPARE
Immigrants from Iran
Sudanese
Poverty
Poverty Comparison
Immigrants from Iran
Sudanese
10.9%
POVERTY
99.2/ 100
METRIC RATING
41st/ 347
METRIC RANK
14.0%
POVERTY
0.3/ 100
METRIC RATING
243rd/ 347
METRIC RANK
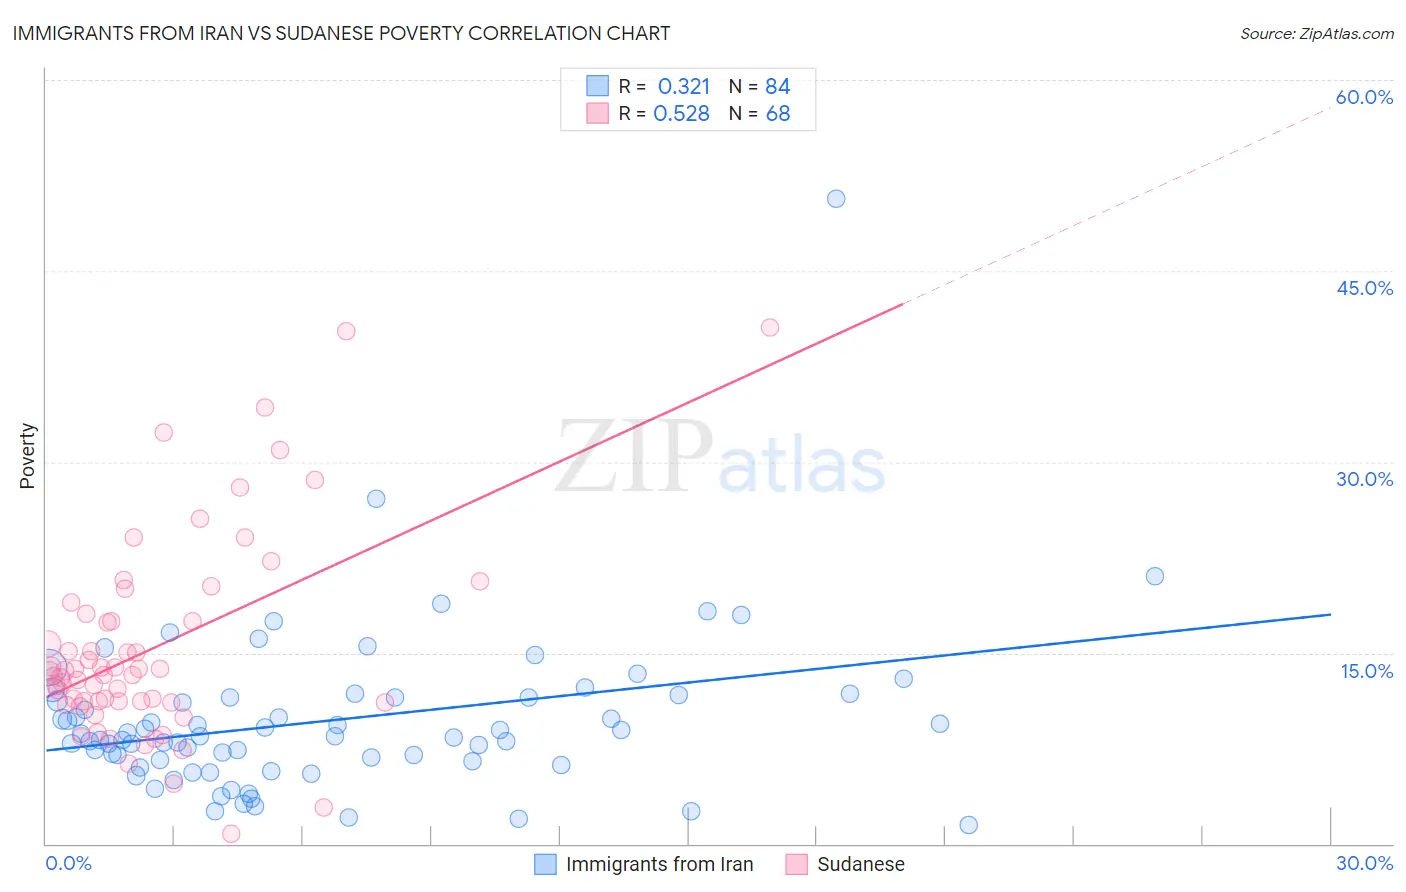
Immigrants from Iran vs Sudanese Poverty Correlation Chart
The statistical analysis conducted on geographies consisting of 279,844,732 people shows a mild positive correlation between the proportion of Immigrants from Iran and poverty level in the United States with a correlation coefficient (R) of 0.321 and weighted average of 10.9%. Similarly, the statistical analysis conducted on geographies consisting of 110,120,634 people shows a substantial positive correlation between the proportion of Sudanese and poverty level in the United States with a correlation coefficient (R) of 0.528 and weighted average of 14.0%, a difference of 29.0%.
Poverty Correlation Summary
| Measurement | Immigrants from Iran | Sudanese |
| Minimum | 1.5% | 0.75% |
| Maximum | 50.6% | 40.5% |
| Range | 49.1% | 39.8% |
| Mean | 9.7% | 15.4% |
| Median | 8.4% | 13.4% |
| Interquartile 25% (IQ1) | 6.5% | 11.2% |
| Interquartile 75% (IQ3) | 11.5% | 17.8% |
| Interquartile Range (IQR) | 5.0% | 6.6% |
| Standard Deviation (Sample) | 6.4% | 7.9% |
| Standard Deviation (Population) | 6.4% | 7.8% |
Similar Demographics by Poverty
Demographics Similar to Immigrants from Iran by Poverty
In terms of poverty, the demographic groups most similar to Immigrants from Iran are Russian (10.9%, a difference of 0.090%), Immigrants from Pakistan (10.8%, a difference of 0.14%), Czech (10.8%, a difference of 0.22%), Korean (10.9%, a difference of 0.22%), and Immigrants from Greece (10.8%, a difference of 0.26%).
| Demographics | Rating | Rank | Poverty |
| Immigrants | Poland | 99.4 /100 | #34 | Exceptional 10.8% |
| Tongans | 99.4 /100 | #35 | Exceptional 10.8% |
| Cypriots | 99.3 /100 | #36 | Exceptional 10.8% |
| Immigrants | Greece | 99.3 /100 | #37 | Exceptional 10.8% |
| Czechs | 99.3 /100 | #38 | Exceptional 10.8% |
| Immigrants | Pakistan | 99.3 /100 | #39 | Exceptional 10.8% |
| Russians | 99.3 /100 | #40 | Exceptional 10.9% |
| Immigrants | Iran | 99.2 /100 | #41 | Exceptional 10.9% |
| Koreans | 99.2 /100 | #42 | Exceptional 10.9% |
| Immigrants | Singapore | 99.2 /100 | #43 | Exceptional 10.9% |
| Immigrants | Moldova | 99.1 /100 | #44 | Exceptional 10.9% |
| Turks | 98.9 /100 | #45 | Exceptional 11.0% |
| Immigrants | Czechoslovakia | 98.9 /100 | #46 | Exceptional 11.0% |
| Immigrants | Romania | 98.9 /100 | #47 | Exceptional 11.0% |
| Slovenes | 98.9 /100 | #48 | Exceptional 11.0% |
Demographics Similar to Sudanese by Poverty
In terms of poverty, the demographic groups most similar to Sudanese are Nepalese (14.0%, a difference of 0.030%), Ecuadorian (14.0%, a difference of 0.070%), Salvadoran (14.0%, a difference of 0.39%), Immigrants from Middle Africa (14.0%, a difference of 0.41%), and Immigrants from Sudan (14.1%, a difference of 0.42%).
| Demographics | Rating | Rank | Poverty |
| Immigrants | Armenia | 0.5 /100 | #236 | Tragic 13.9% |
| French American Indians | 0.5 /100 | #237 | Tragic 13.9% |
| Ghanaians | 0.5 /100 | #238 | Tragic 13.9% |
| Nicaraguans | 0.4 /100 | #239 | Tragic 13.9% |
| Immigrants | Middle Africa | 0.4 /100 | #240 | Tragic 14.0% |
| Salvadorans | 0.4 /100 | #241 | Tragic 14.0% |
| Ecuadorians | 0.4 /100 | #242 | Tragic 14.0% |
| Sudanese | 0.3 /100 | #243 | Tragic 14.0% |
| Nepalese | 0.3 /100 | #244 | Tragic 14.0% |
| Immigrants | Sudan | 0.3 /100 | #245 | Tragic 14.1% |
| Potawatomi | 0.3 /100 | #246 | Tragic 14.1% |
| Liberians | 0.2 /100 | #247 | Tragic 14.1% |
| Immigrants | Western Africa | 0.2 /100 | #248 | Tragic 14.1% |
| Immigrants | Ghana | 0.2 /100 | #249 | Tragic 14.2% |
| Cree | 0.2 /100 | #250 | Tragic 14.2% |