Immigrants from Iran vs Shoshone Male Poverty
COMPARE
Immigrants from Iran
Shoshone
Male Poverty
Male Poverty Comparison
Immigrants from Iran
Shoshone
9.9%
MALE POVERTY
99.1/ 100
METRIC RATING
42nd/ 347
METRIC RANK
13.8%
MALE POVERTY
0.0/ 100
METRIC RATING
286th/ 347
METRIC RANK
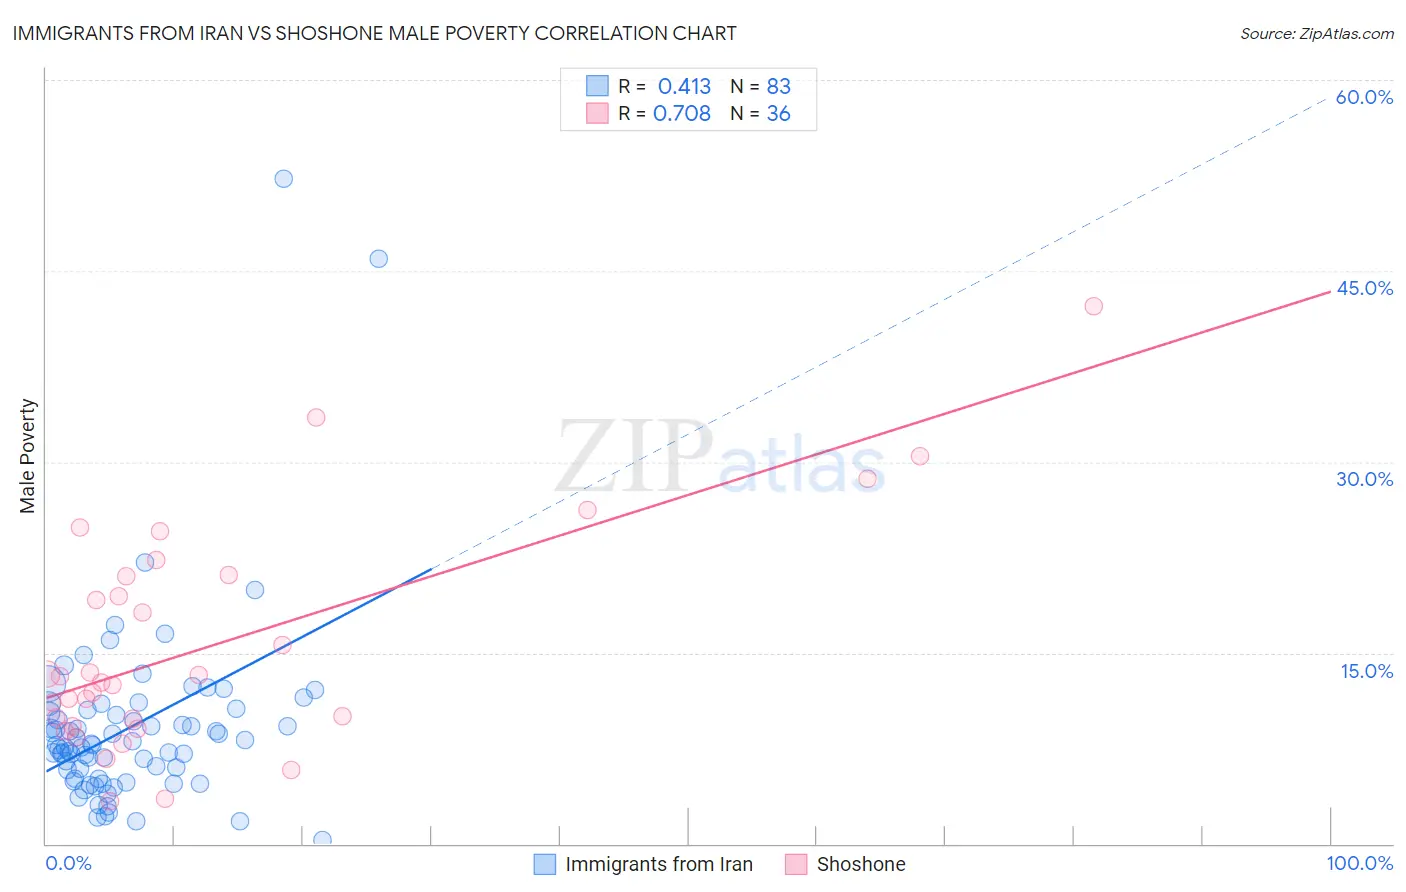
Immigrants from Iran vs Shoshone Male Poverty Correlation Chart
The statistical analysis conducted on geographies consisting of 279,773,882 people shows a moderate positive correlation between the proportion of Immigrants from Iran and poverty level among males in the United States with a correlation coefficient (R) of 0.413 and weighted average of 9.9%. Similarly, the statistical analysis conducted on geographies consisting of 66,615,440 people shows a strong positive correlation between the proportion of Shoshone and poverty level among males in the United States with a correlation coefficient (R) of 0.708 and weighted average of 13.8%, a difference of 39.0%.
Male Poverty Correlation Summary
| Measurement | Immigrants from Iran | Shoshone |
| Minimum | 0.33% | 3.3% |
| Maximum | 52.3% | 42.2% |
| Range | 51.9% | 38.9% |
| Mean | 9.2% | 15.7% |
| Median | 7.8% | 12.9% |
| Interquartile 25% (IQ1) | 5.1% | 9.5% |
| Interquartile 75% (IQ3) | 10.5% | 21.1% |
| Interquartile Range (IQR) | 5.4% | 11.5% |
| Standard Deviation (Sample) | 7.5% | 8.9% |
| Standard Deviation (Population) | 7.4% | 8.8% |
Similar Demographics by Male Poverty
Demographics Similar to Immigrants from Iran by Male Poverty
In terms of male poverty, the demographic groups most similar to Immigrants from Iran are Korean (9.9%, a difference of 0.24%), Immigrants from Moldova (9.9%, a difference of 0.26%), Cypriot (9.9%, a difference of 0.34%), Immigrants from Pakistan (9.9%, a difference of 0.42%), and Russian (9.9%, a difference of 0.42%).
| Demographics | Rating | Rank | Male Poverty |
| Iranians | 99.4 /100 | #35 | Exceptional 9.8% |
| Czechs | 99.4 /100 | #36 | Exceptional 9.8% |
| Immigrants | Greece | 99.3 /100 | #37 | Exceptional 9.8% |
| Immigrants | Pakistan | 99.2 /100 | #38 | Exceptional 9.9% |
| Russians | 99.2 /100 | #39 | Exceptional 9.9% |
| Cypriots | 99.2 /100 | #40 | Exceptional 9.9% |
| Koreans | 99.2 /100 | #41 | Exceptional 9.9% |
| Immigrants | Iran | 99.1 /100 | #42 | Exceptional 9.9% |
| Immigrants | Moldova | 99.0 /100 | #43 | Exceptional 9.9% |
| Immigrants | Romania | 98.9 /100 | #44 | Exceptional 9.9% |
| Immigrants | Serbia | 98.9 /100 | #45 | Exceptional 10.0% |
| Turks | 98.9 /100 | #46 | Exceptional 10.0% |
| Immigrants | Singapore | 98.8 /100 | #47 | Exceptional 10.0% |
| Immigrants | Japan | 98.8 /100 | #48 | Exceptional 10.0% |
| Slovenes | 98.8 /100 | #49 | Exceptional 10.0% |
Demographics Similar to Shoshone by Male Poverty
In terms of male poverty, the demographic groups most similar to Shoshone are Immigrants from Barbados (13.8%, a difference of 0.020%), West Indian (13.8%, a difference of 0.030%), Immigrants from Haiti (13.8%, a difference of 0.040%), Comanche (13.8%, a difference of 0.050%), and Immigrants from St. Vincent and the Grenadines (13.8%, a difference of 0.18%).
| Demographics | Rating | Rank | Male Poverty |
| Haitians | 0.0 /100 | #279 | Tragic 13.7% |
| Mexicans | 0.0 /100 | #280 | Tragic 13.7% |
| Yaqui | 0.0 /100 | #281 | Tragic 13.7% |
| Immigrants | Cabo Verde | 0.0 /100 | #282 | Tragic 13.7% |
| Comanche | 0.0 /100 | #283 | Tragic 13.8% |
| Immigrants | Haiti | 0.0 /100 | #284 | Tragic 13.8% |
| West Indians | 0.0 /100 | #285 | Tragic 13.8% |
| Shoshone | 0.0 /100 | #286 | Tragic 13.8% |
| Immigrants | Barbados | 0.0 /100 | #287 | Tragic 13.8% |
| Immigrants | St. Vincent and the Grenadines | 0.0 /100 | #288 | Tragic 13.8% |
| Guatemalans | 0.0 /100 | #289 | Tragic 13.8% |
| Immigrants | Zaire | 0.0 /100 | #290 | Tragic 13.8% |
| Vietnamese | 0.0 /100 | #291 | Tragic 13.8% |
| Indonesians | 0.0 /100 | #292 | Tragic 13.8% |
| Immigrants | Belize | 0.0 /100 | #293 | Tragic 13.8% |