Immigrants from Indonesia vs Burmese Single Male Poverty
COMPARE
Immigrants from Indonesia
Burmese
Single Male Poverty
Single Male Poverty Comparison
Immigrants from Indonesia
Burmese
11.6%
SINGLE MALE POVERTY
99.9/ 100
METRIC RATING
48th/ 347
METRIC RANK
11.7%
SINGLE MALE POVERTY
99.8/ 100
METRIC RATING
56th/ 347
METRIC RANK
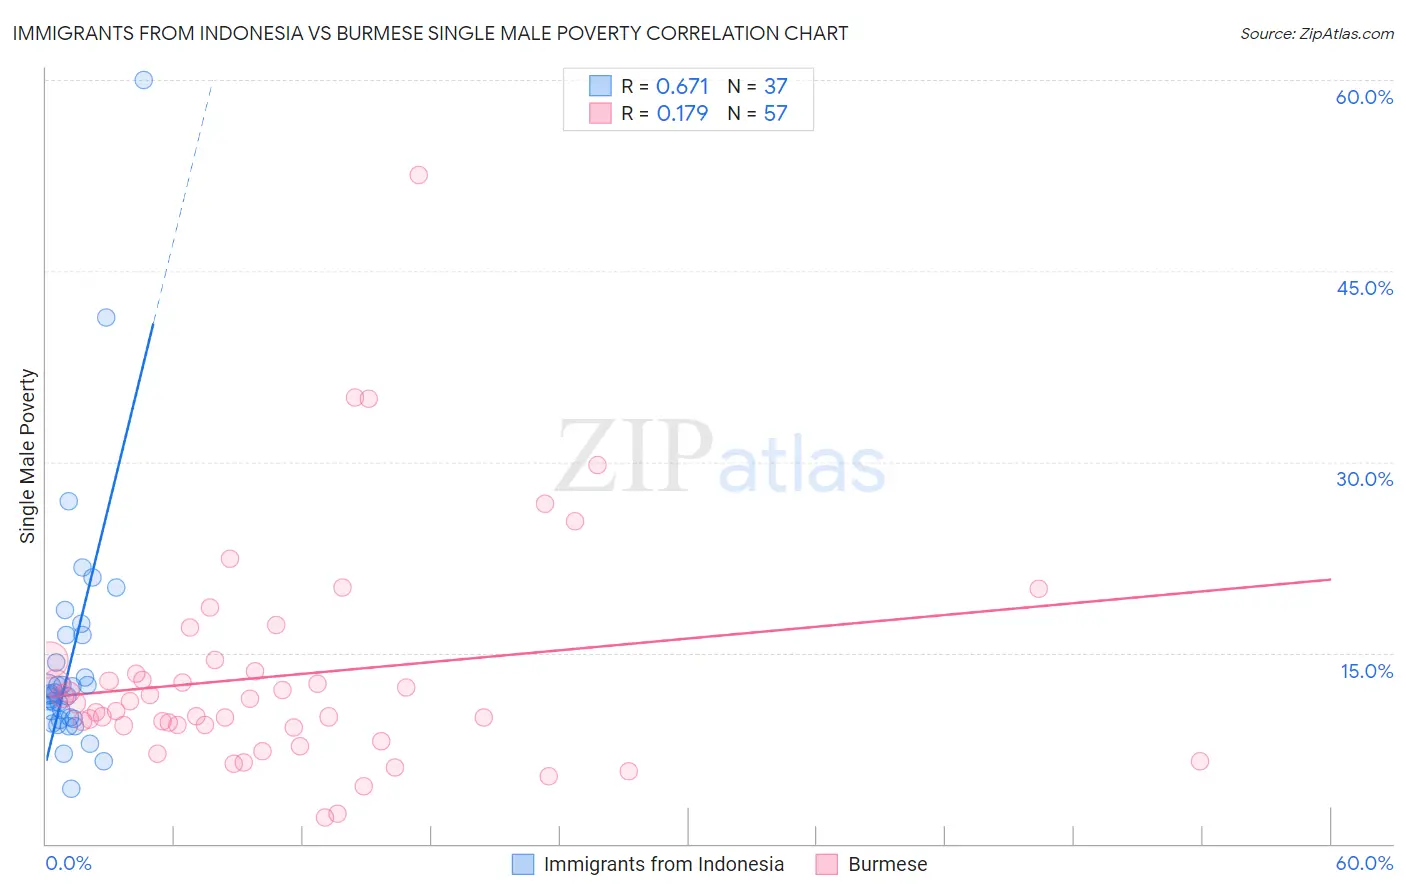
Immigrants from Indonesia vs Burmese Single Male Poverty Correlation Chart
The statistical analysis conducted on geographies consisting of 200,544,788 people shows a significant positive correlation between the proportion of Immigrants from Indonesia and poverty level among single males in the United States with a correlation coefficient (R) of 0.671 and weighted average of 11.6%. Similarly, the statistical analysis conducted on geographies consisting of 402,925,869 people shows a poor positive correlation between the proportion of Burmese and poverty level among single males in the United States with a correlation coefficient (R) of 0.179 and weighted average of 11.7%, a difference of 1.1%.
Single Male Poverty Correlation Summary
| Measurement | Immigrants from Indonesia | Burmese |
| Minimum | 4.3% | 2.0% |
| Maximum | 60.0% | 52.6% |
| Range | 55.7% | 50.5% |
| Mean | 14.7% | 13.2% |
| Median | 11.7% | 11.0% |
| Interquartile 25% (IQ1) | 9.8% | 9.2% |
| Interquartile 75% (IQ3) | 16.4% | 14.0% |
| Interquartile Range (IQR) | 6.6% | 4.8% |
| Standard Deviation (Sample) | 10.1% | 8.8% |
| Standard Deviation (Population) | 9.9% | 8.7% |
Demographics Similar to Immigrants from Indonesia and Burmese by Single Male Poverty
In terms of single male poverty, the demographic groups most similar to Immigrants from Indonesia are Tlingit-Haida (11.6%, a difference of 0.020%), Nepalese (11.6%, a difference of 0.080%), Immigrants from Lithuania (11.6%, a difference of 0.080%), Paraguayan (11.6%, a difference of 0.19%), and Immigrants from Bulgaria (11.6%, a difference of 0.27%). Similarly, the demographic groups most similar to Burmese are Immigrants from Romania (11.7%, a difference of 0.15%), Immigrants from Brazil (11.7%, a difference of 0.17%), Brazilian (11.8%, a difference of 0.26%), Cypriot (11.7%, a difference of 0.31%), and Peruvian (11.8%, a difference of 0.47%).
| Demographics | Rating | Rank | Single Male Poverty |
| Egyptians | 99.9 /100 | #42 | Exceptional 11.5% |
| Immigrants | Peru | 99.9 /100 | #43 | Exceptional 11.5% |
| Immigrants | Cameroon | 99.9 /100 | #44 | Exceptional 11.5% |
| Immigrants | Poland | 99.9 /100 | #45 | Exceptional 11.5% |
| Immigrants | Bulgaria | 99.9 /100 | #46 | Exceptional 11.6% |
| Nepalese | 99.9 /100 | #47 | Exceptional 11.6% |
| Immigrants | Indonesia | 99.9 /100 | #48 | Exceptional 11.6% |
| Tlingit-Haida | 99.9 /100 | #49 | Exceptional 11.6% |
| Immigrants | Lithuania | 99.9 /100 | #50 | Exceptional 11.6% |
| Paraguayans | 99.9 /100 | #51 | Exceptional 11.6% |
| Samoans | 99.9 /100 | #52 | Exceptional 11.7% |
| Bulgarians | 99.9 /100 | #53 | Exceptional 11.7% |
| Immigrants | Uzbekistan | 99.9 /100 | #54 | Exceptional 11.7% |
| Cypriots | 99.9 /100 | #55 | Exceptional 11.7% |
| Burmese | 99.8 /100 | #56 | Exceptional 11.7% |
| Immigrants | Romania | 99.8 /100 | #57 | Exceptional 11.7% |
| Immigrants | Brazil | 99.8 /100 | #58 | Exceptional 11.7% |
| Brazilians | 99.8 /100 | #59 | Exceptional 11.8% |
| Peruvians | 99.8 /100 | #60 | Exceptional 11.8% |
| Cambodians | 99.8 /100 | #61 | Exceptional 11.8% |
| Immigrants | Sri Lanka | 99.7 /100 | #62 | Exceptional 11.8% |