Immigrants from Haiti vs Immigrants from Czechoslovakia Unemployment Among Ages 45 to 54 years
COMPARE
Immigrants from Haiti
Immigrants from Czechoslovakia
Unemployment Among Ages 45 to 54 years
Unemployment Among Ages 45 to 54 years Comparison
Immigrants from Haiti
Immigrants from Czechoslovakia
5.2%
UNEMPLOYMENT AMONG AGES 45 TO 54 YEARS
0.0/ 100
METRIC RATING
289th/ 347
METRIC RANK
4.4%
UNEMPLOYMENT AMONG AGES 45 TO 54 YEARS
87.8/ 100
METRIC RATING
126th/ 347
METRIC RANK
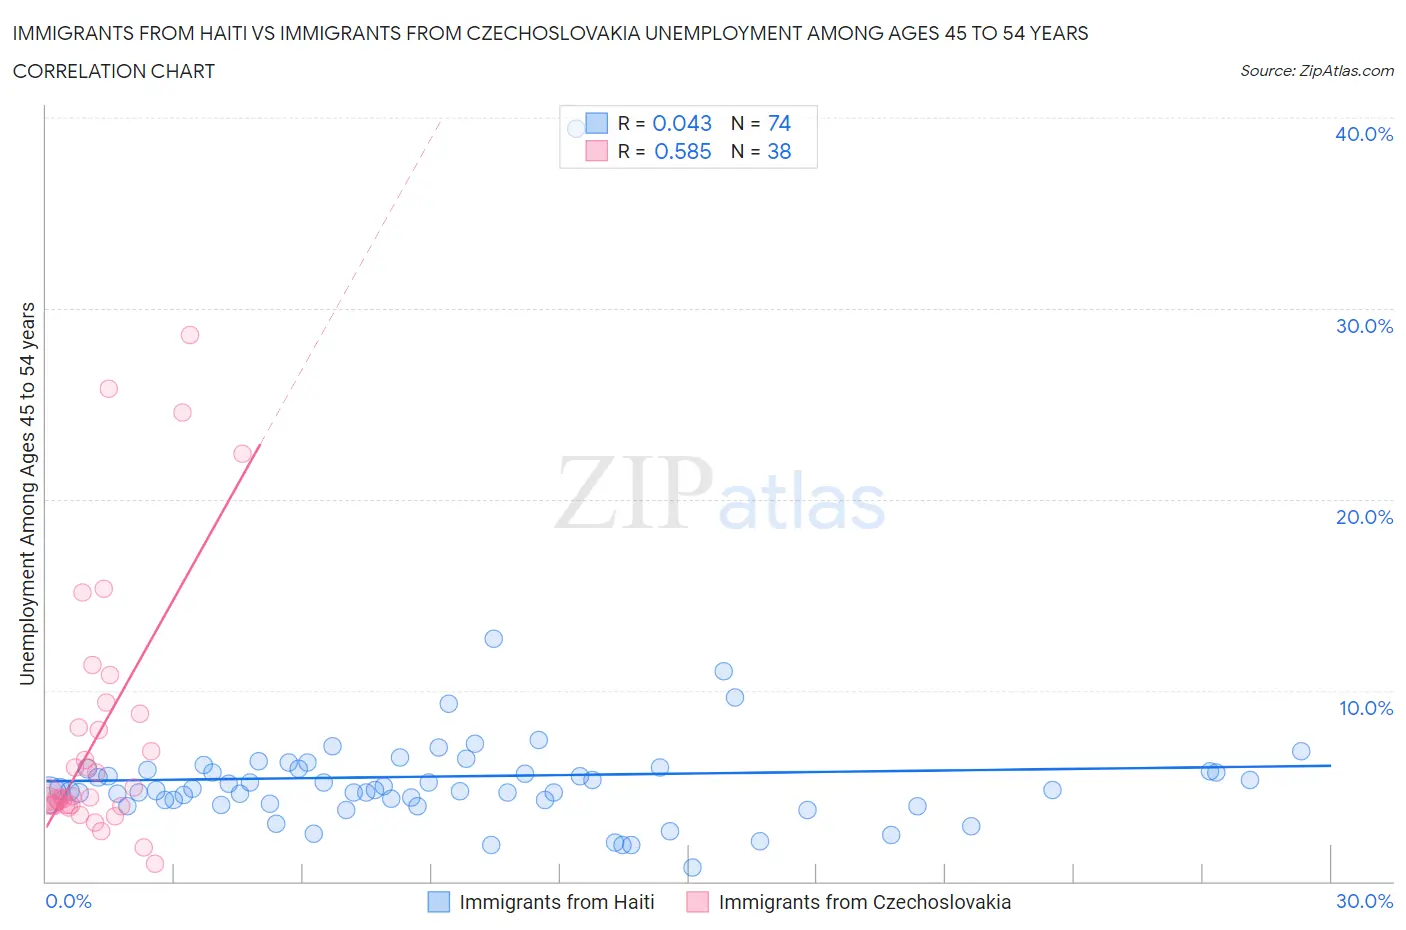
Immigrants from Haiti vs Immigrants from Czechoslovakia Unemployment Among Ages 45 to 54 years Correlation Chart
The statistical analysis conducted on geographies consisting of 221,731,051 people shows no correlation between the proportion of Immigrants from Haiti and unemployment rate among population between the ages 45 and 54 in the United States with a correlation coefficient (R) of 0.043 and weighted average of 5.2%. Similarly, the statistical analysis conducted on geographies consisting of 193,143,676 people shows a substantial positive correlation between the proportion of Immigrants from Czechoslovakia and unemployment rate among population between the ages 45 and 54 in the United States with a correlation coefficient (R) of 0.585 and weighted average of 4.4%, a difference of 17.6%.
Unemployment Among Ages 45 to 54 years Correlation Summary
| Measurement | Immigrants from Haiti | Immigrants from Czechoslovakia |
| Minimum | 0.70% | 0.90% |
| Maximum | 39.4% | 28.6% |
| Range | 38.7% | 27.7% |
| Mean | 5.5% | 7.8% |
| Median | 4.8% | 4.4% |
| Interquartile 25% (IQ1) | 4.2% | 4.0% |
| Interquartile 75% (IQ3) | 5.9% | 8.8% |
| Interquartile Range (IQR) | 1.6% | 4.8% |
| Standard Deviation (Sample) | 4.4% | 6.9% |
| Standard Deviation (Population) | 4.4% | 6.8% |
Similar Demographics by Unemployment Among Ages 45 to 54 years
Demographics Similar to Immigrants from Haiti by Unemployment Among Ages 45 to 54 years
In terms of unemployment among ages 45 to 54 years, the demographic groups most similar to Immigrants from Haiti are Immigrants from Portugal (5.2%, a difference of 0.16%), Armenian (5.2%, a difference of 0.17%), Immigrants from Caribbean (5.2%, a difference of 0.39%), Trinidadian and Tobagonian (5.2%, a difference of 0.40%), and Immigrants from Senegal (5.2%, a difference of 0.41%).
| Demographics | Rating | Rank | Unemployment Among Ages 45 to 54 years |
| Africans | 0.0 /100 | #282 | Tragic 5.1% |
| Hispanics or Latinos | 0.0 /100 | #283 | Tragic 5.1% |
| Kiowa | 0.0 /100 | #284 | Tragic 5.1% |
| Iroquois | 0.0 /100 | #285 | Tragic 5.1% |
| Senegalese | 0.0 /100 | #286 | Tragic 5.1% |
| Haitians | 0.0 /100 | #287 | Tragic 5.2% |
| Immigrants | Caribbean | 0.0 /100 | #288 | Tragic 5.2% |
| Immigrants | Haiti | 0.0 /100 | #289 | Tragic 5.2% |
| Immigrants | Portugal | 0.0 /100 | #290 | Tragic 5.2% |
| Armenians | 0.0 /100 | #291 | Tragic 5.2% |
| Trinidadians and Tobagonians | 0.0 /100 | #292 | Tragic 5.2% |
| Immigrants | Senegal | 0.0 /100 | #293 | Tragic 5.2% |
| Belizeans | 0.0 /100 | #294 | Tragic 5.2% |
| Jamaicans | 0.0 /100 | #295 | Tragic 5.3% |
| Aleuts | 0.0 /100 | #296 | Tragic 5.3% |
Demographics Similar to Immigrants from Czechoslovakia by Unemployment Among Ages 45 to 54 years
In terms of unemployment among ages 45 to 54 years, the demographic groups most similar to Immigrants from Czechoslovakia are Nicaraguan (4.4%, a difference of 0.010%), Immigrants from Northern Europe (4.4%, a difference of 0.090%), Immigrants from Vietnam (4.4%, a difference of 0.10%), Immigrants from Asia (4.4%, a difference of 0.12%), and Spanish (4.4%, a difference of 0.12%).
| Demographics | Rating | Rank | Unemployment Among Ages 45 to 54 years |
| Native Hawaiians | 90.0 /100 | #119 | Excellent 4.4% |
| Americans | 89.6 /100 | #120 | Excellent 4.4% |
| Immigrants | Oceania | 89.5 /100 | #121 | Excellent 4.4% |
| Immigrants | Kazakhstan | 89.5 /100 | #122 | Excellent 4.4% |
| Immigrants | Asia | 88.8 /100 | #123 | Excellent 4.4% |
| Spanish | 88.8 /100 | #124 | Excellent 4.4% |
| Immigrants | Vietnam | 88.6 /100 | #125 | Excellent 4.4% |
| Immigrants | Czechoslovakia | 87.8 /100 | #126 | Excellent 4.4% |
| Nicaraguans | 87.6 /100 | #127 | Excellent 4.4% |
| Immigrants | Northern Europe | 86.9 /100 | #128 | Excellent 4.4% |
| Laotians | 86.3 /100 | #129 | Excellent 4.4% |
| Celtics | 86.2 /100 | #130 | Excellent 4.4% |
| Immigrants | Germany | 85.9 /100 | #131 | Excellent 4.4% |
| Immigrants | Eastern Africa | 85.1 /100 | #132 | Excellent 4.4% |
| Immigrants | Cameroon | 84.8 /100 | #133 | Excellent 4.4% |