Immigrants from Haiti vs Polish Single Father Poverty
COMPARE
Immigrants from Haiti
Polish
Single Father Poverty
Single Father Poverty Comparison
Immigrants from Haiti
Poles
17.2%
SINGLE FATHER POVERTY
0.8/ 100
METRIC RATING
256th/ 347
METRIC RANK
17.3%
SINGLE FATHER POVERTY
0.3/ 100
METRIC RATING
265th/ 347
METRIC RANK
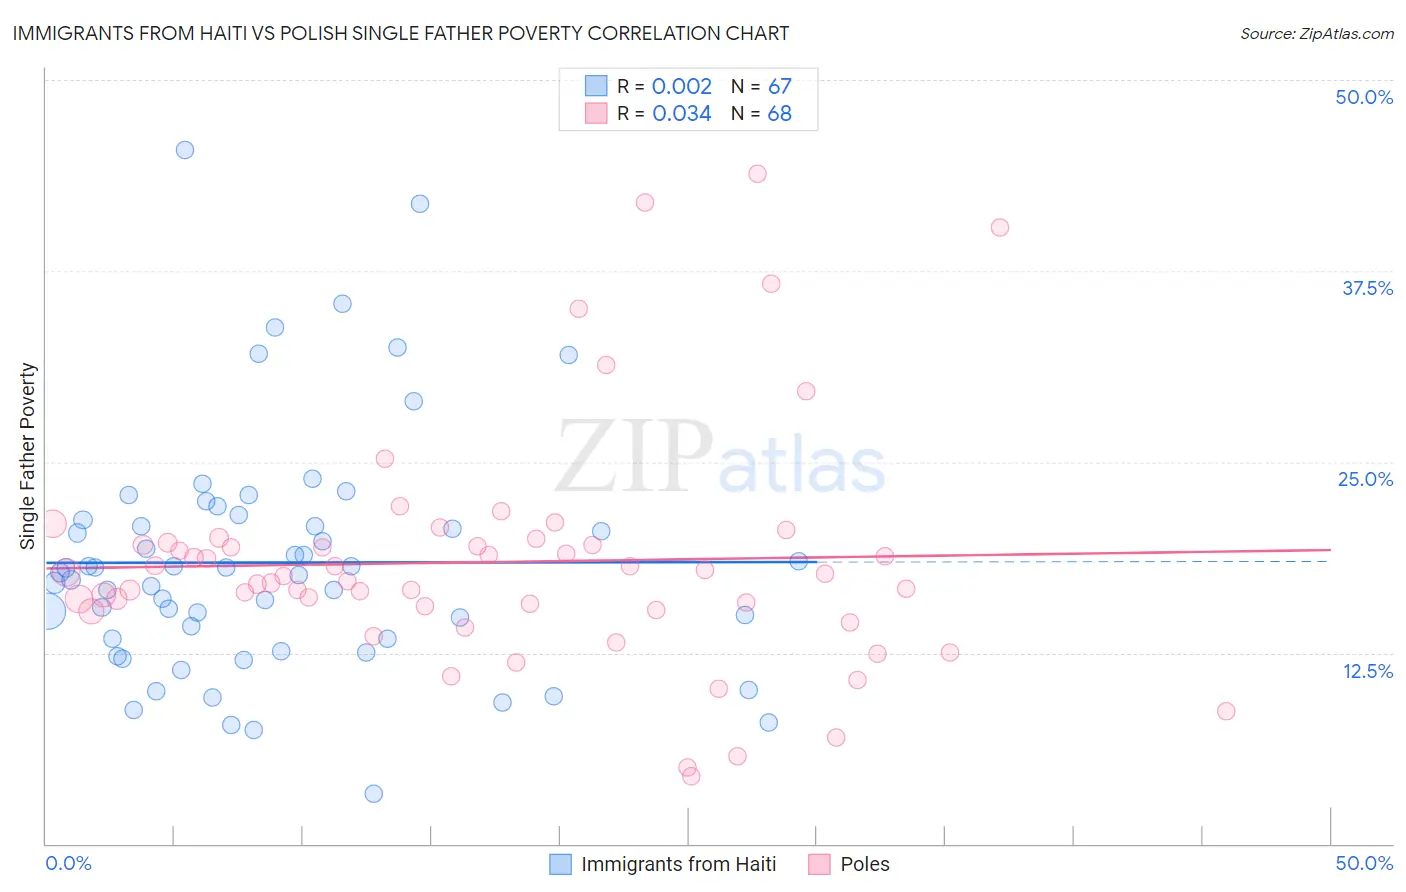
Immigrants from Haiti vs Polish Single Father Poverty Correlation Chart
The statistical analysis conducted on geographies consisting of 189,968,112 people shows no correlation between the proportion of Immigrants from Haiti and poverty level among single fathers in the United States with a correlation coefficient (R) of 0.002 and weighted average of 17.2%. Similarly, the statistical analysis conducted on geographies consisting of 402,702,262 people shows no correlation between the proportion of Poles and poverty level among single fathers in the United States with a correlation coefficient (R) of 0.034 and weighted average of 17.3%, a difference of 0.86%.
Single Father Poverty Correlation Summary
| Measurement | Immigrants from Haiti | Polish |
| Minimum | 3.3% | 4.5% |
| Maximum | 45.4% | 43.8% |
| Range | 42.1% | 39.4% |
| Mean | 18.4% | 18.4% |
| Median | 17.8% | 17.6% |
| Interquartile 25% (IQ1) | 13.4% | 15.4% |
| Interquartile 75% (IQ3) | 21.2% | 19.6% |
| Interquartile Range (IQR) | 7.8% | 4.2% |
| Standard Deviation (Sample) | 7.9% | 7.7% |
| Standard Deviation (Population) | 7.8% | 7.6% |
Demographics Similar to Immigrants from Haiti and Poles by Single Father Poverty
In terms of single father poverty, the demographic groups most similar to Immigrants from Haiti are Sierra Leonean (17.2%, a difference of 0.010%), Immigrants from Albania (17.2%, a difference of 0.080%), Albanian (17.2%, a difference of 0.10%), Immigrants from Jamaica (17.2%, a difference of 0.13%), and Immigrants from Honduras (17.1%, a difference of 0.19%). Similarly, the demographic groups most similar to Poles are Slovene (17.3%, a difference of 0.0%), Jamaican (17.3%, a difference of 0.060%), Haitian (17.3%, a difference of 0.090%), Immigrants from Caribbean (17.4%, a difference of 0.19%), and Lithuanian (17.3%, a difference of 0.21%).
| Demographics | Rating | Rank | Single Father Poverty |
| Austrians | 1.1 /100 | #250 | Tragic 17.1% |
| Luxembourgers | 1.1 /100 | #251 | Tragic 17.1% |
| Croatians | 1.0 /100 | #252 | Tragic 17.1% |
| Cree | 1.0 /100 | #253 | Tragic 17.1% |
| Immigrants | Honduras | 0.9 /100 | #254 | Tragic 17.1% |
| Sierra Leoneans | 0.8 /100 | #255 | Tragic 17.2% |
| Immigrants | Haiti | 0.8 /100 | #256 | Tragic 17.2% |
| Immigrants | Albania | 0.7 /100 | #257 | Tragic 17.2% |
| Albanians | 0.7 /100 | #258 | Tragic 17.2% |
| Immigrants | Jamaica | 0.7 /100 | #259 | Tragic 17.2% |
| Spaniards | 0.6 /100 | #260 | Tragic 17.2% |
| Swiss | 0.5 /100 | #261 | Tragic 17.3% |
| Immigrants | Zaire | 0.4 /100 | #262 | Tragic 17.3% |
| Lithuanians | 0.4 /100 | #263 | Tragic 17.3% |
| Slovenes | 0.3 /100 | #264 | Tragic 17.3% |
| Poles | 0.3 /100 | #265 | Tragic 17.3% |
| Jamaicans | 0.3 /100 | #266 | Tragic 17.3% |
| Haitians | 0.3 /100 | #267 | Tragic 17.3% |
| Immigrants | Caribbean | 0.3 /100 | #268 | Tragic 17.4% |
| Slavs | 0.3 /100 | #269 | Tragic 17.4% |
| Indonesians | 0.2 /100 | #270 | Tragic 17.4% |