Immigrants from Greece vs Shoshone Unemployment Among Ages 35 to 44 years
COMPARE
Immigrants from Greece
Shoshone
Unemployment Among Ages 35 to 44 years
Unemployment Among Ages 35 to 44 years Comparison
Immigrants from Greece
Shoshone
4.5%
UNEMPLOYMENT AMONG AGES 35 TO 44 YEARS
87.9/ 100
METRIC RATING
117th/ 347
METRIC RANK
6.6%
UNEMPLOYMENT AMONG AGES 35 TO 44 YEARS
0.0/ 100
METRIC RATING
328th/ 347
METRIC RANK
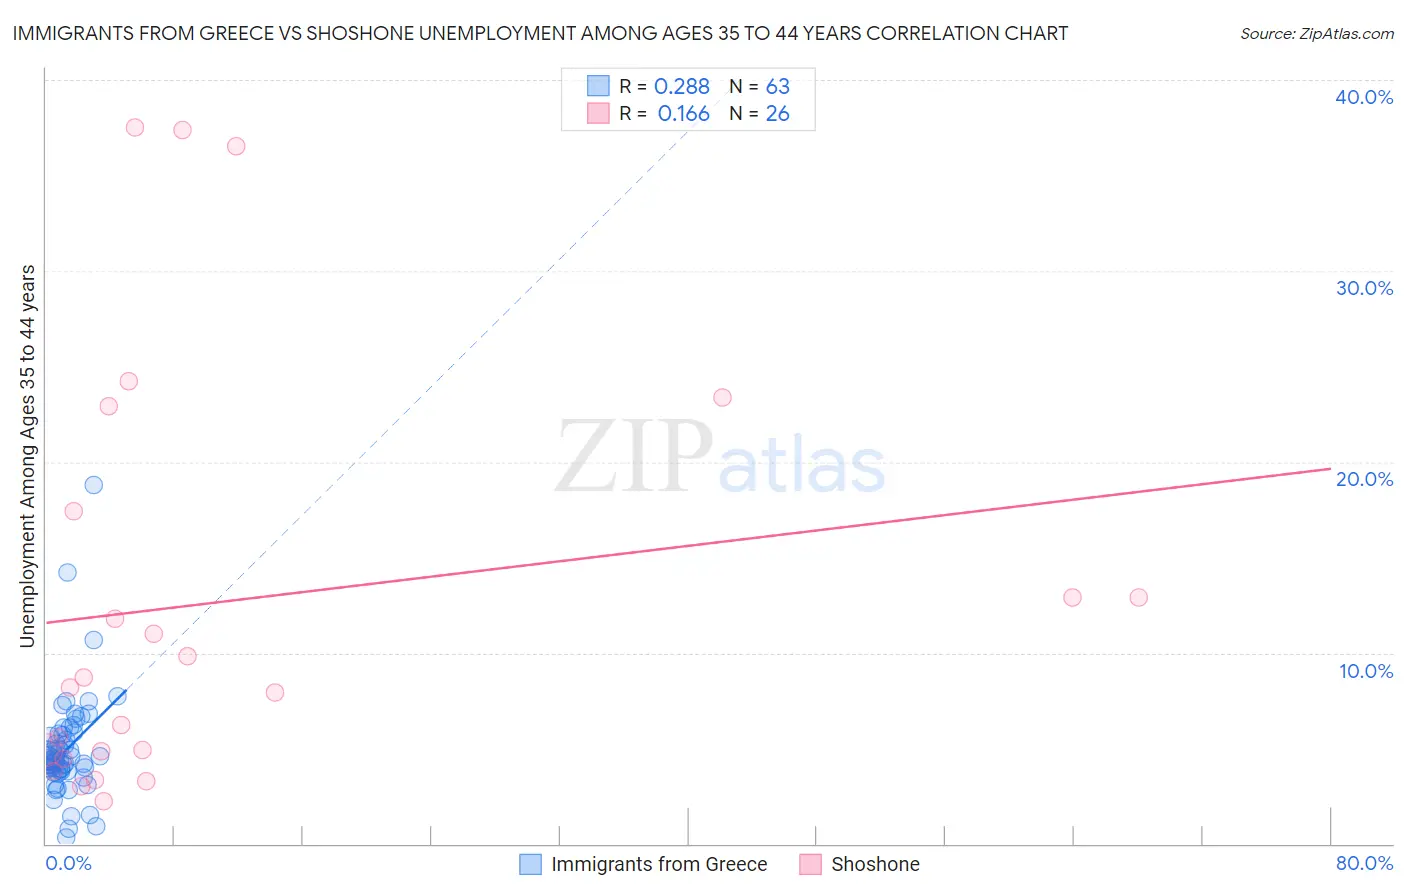
Immigrants from Greece vs Shoshone Unemployment Among Ages 35 to 44 years Correlation Chart
The statistical analysis conducted on geographies consisting of 214,208,810 people shows a weak positive correlation between the proportion of Immigrants from Greece and unemployment rate among population between the ages 35 and 44 in the United States with a correlation coefficient (R) of 0.288 and weighted average of 4.5%. Similarly, the statistical analysis conducted on geographies consisting of 66,150,658 people shows a poor positive correlation between the proportion of Shoshone and unemployment rate among population between the ages 35 and 44 in the United States with a correlation coefficient (R) of 0.166 and weighted average of 6.6%, a difference of 46.0%.
Unemployment Among Ages 35 to 44 years Correlation Summary
| Measurement | Immigrants from Greece | Shoshone |
| Minimum | 0.30% | 2.2% |
| Maximum | 18.8% | 37.5% |
| Range | 18.5% | 35.3% |
| Mean | 4.9% | 12.7% |
| Median | 4.5% | 8.5% |
| Interquartile 25% (IQ1) | 3.8% | 4.9% |
| Interquartile 75% (IQ3) | 5.7% | 17.4% |
| Interquartile Range (IQR) | 1.9% | 12.5% |
| Standard Deviation (Sample) | 2.8% | 11.0% |
| Standard Deviation (Population) | 2.8% | 10.8% |
Similar Demographics by Unemployment Among Ages 35 to 44 years
Demographics Similar to Immigrants from Greece by Unemployment Among Ages 35 to 44 years
In terms of unemployment among ages 35 to 44 years, the demographic groups most similar to Immigrants from Greece are Irish (4.5%, a difference of 0.010%), Immigrants from Israel (4.5%, a difference of 0.020%), Maltese (4.5%, a difference of 0.030%), Macedonian (4.5%, a difference of 0.060%), and Nicaraguan (4.5%, a difference of 0.060%).
| Demographics | Rating | Rank | Unemployment Among Ages 35 to 44 years |
| Immigrants | Kazakhstan | 90.0 /100 | #110 | Excellent 4.5% |
| Immigrants | Nicaragua | 89.8 /100 | #111 | Excellent 4.5% |
| Immigrants | Czechoslovakia | 89.2 /100 | #112 | Excellent 4.5% |
| Immigrants | Italy | 88.4 /100 | #113 | Excellent 4.5% |
| Macedonians | 88.3 /100 | #114 | Excellent 4.5% |
| Maltese | 88.1 /100 | #115 | Excellent 4.5% |
| Immigrants | Israel | 88.1 /100 | #116 | Excellent 4.5% |
| Immigrants | Greece | 87.9 /100 | #117 | Excellent 4.5% |
| Irish | 87.9 /100 | #118 | Excellent 4.5% |
| Nicaraguans | 87.6 /100 | #119 | Excellent 4.5% |
| Ethiopians | 87.1 /100 | #120 | Excellent 4.5% |
| Immigrants | South Africa | 86.8 /100 | #121 | Excellent 4.5% |
| Sri Lankans | 86.8 /100 | #122 | Excellent 4.5% |
| Basques | 86.3 /100 | #123 | Excellent 4.5% |
| Immigrants | Spain | 86.1 /100 | #124 | Excellent 4.5% |
Demographics Similar to Shoshone by Unemployment Among Ages 35 to 44 years
In terms of unemployment among ages 35 to 44 years, the demographic groups most similar to Shoshone are Cape Verdean (6.6%, a difference of 0.69%), Alaska Native (6.6%, a difference of 0.74%), Immigrants from Yemen (6.6%, a difference of 0.81%), Menominee (6.5%, a difference of 1.2%), and Dominican (6.4%, a difference of 2.8%).
| Demographics | Rating | Rank | Unemployment Among Ages 35 to 44 years |
| Chippewa | 0.0 /100 | #321 | Tragic 6.2% |
| Immigrants | Dominican Republic | 0.0 /100 | #322 | Tragic 6.4% |
| Dominicans | 0.0 /100 | #323 | Tragic 6.4% |
| Menominee | 0.0 /100 | #324 | Tragic 6.5% |
| Immigrants | Yemen | 0.0 /100 | #325 | Tragic 6.6% |
| Alaska Natives | 0.0 /100 | #326 | Tragic 6.6% |
| Cape Verdeans | 0.0 /100 | #327 | Tragic 6.6% |
| Shoshone | 0.0 /100 | #328 | Tragic 6.6% |
| Paiute | 0.0 /100 | #329 | Tragic 6.9% |
| Immigrants | Cabo Verde | 0.0 /100 | #330 | Tragic 6.9% |
| Pueblo | 0.0 /100 | #331 | Tragic 7.1% |
| Natives/Alaskans | 0.0 /100 | #332 | Tragic 7.3% |
| Puerto Ricans | 0.0 /100 | #333 | Tragic 7.6% |
| Houma | 0.0 /100 | #334 | Tragic 7.8% |
| Sioux | 0.0 /100 | #335 | Tragic 8.4% |