Immigrants from Ghana vs Chilean Female Poverty
COMPARE
Immigrants from Ghana
Chilean
Female Poverty
Female Poverty Comparison
Immigrants from Ghana
Chileans
15.3%
FEMALE POVERTY
0.3/ 100
METRIC RATING
248th/ 347
METRIC RANK
12.9%
FEMALE POVERTY
84.7/ 100
METRIC RATING
137th/ 347
METRIC RANK
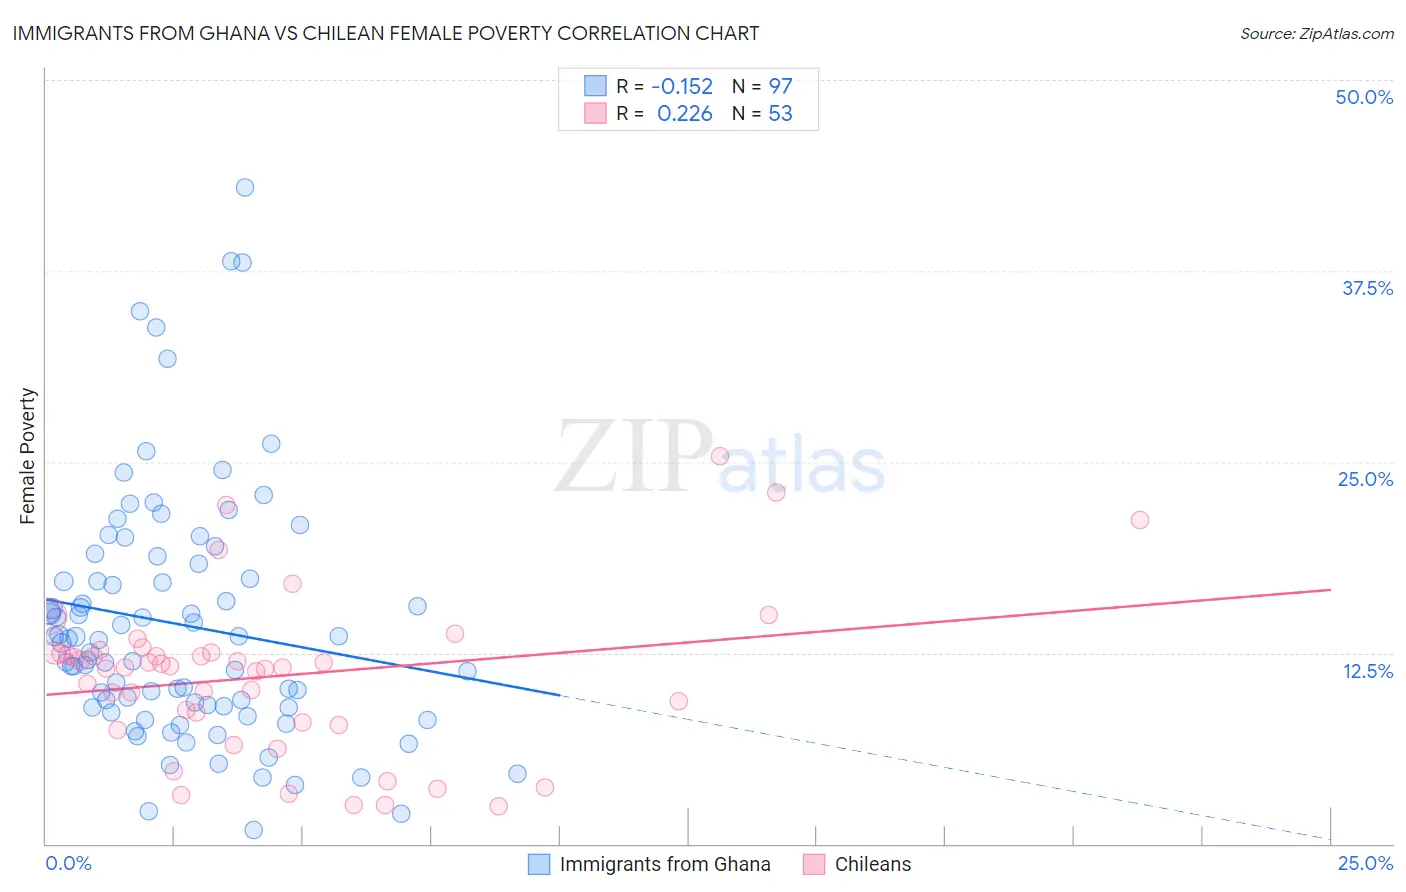
Immigrants from Ghana vs Chilean Female Poverty Correlation Chart
The statistical analysis conducted on geographies consisting of 199,796,197 people shows a poor negative correlation between the proportion of Immigrants from Ghana and poverty level among females in the United States with a correlation coefficient (R) of -0.152 and weighted average of 15.3%. Similarly, the statistical analysis conducted on geographies consisting of 256,534,344 people shows a weak positive correlation between the proportion of Chileans and poverty level among females in the United States with a correlation coefficient (R) of 0.226 and weighted average of 12.9%, a difference of 18.8%.
Female Poverty Correlation Summary
| Measurement | Immigrants from Ghana | Chilean |
| Minimum | 0.90% | 2.5% |
| Maximum | 43.0% | 25.4% |
| Range | 42.1% | 22.9% |
| Mean | 14.3% | 11.0% |
| Median | 13.3% | 11.6% |
| Interquartile 25% (IQ1) | 9.0% | 7.8% |
| Interquartile 75% (IQ3) | 17.8% | 12.5% |
| Interquartile Range (IQR) | 8.9% | 4.7% |
| Standard Deviation (Sample) | 8.1% | 5.2% |
| Standard Deviation (Population) | 8.0% | 5.1% |
Similar Demographics by Female Poverty
Demographics Similar to Immigrants from Ghana by Female Poverty
In terms of female poverty, the demographic groups most similar to Immigrants from Ghana are Potawatomi (15.3%, a difference of 0.0%), Cuban (15.3%, a difference of 0.010%), Spanish American Indian (15.3%, a difference of 0.060%), Salvadoran (15.3%, a difference of 0.14%), and Ecuadorian (15.3%, a difference of 0.16%).
| Demographics | Rating | Rank | Female Poverty |
| Immigrants | Sudan | 0.4 /100 | #241 | Tragic 15.2% |
| Nepalese | 0.4 /100 | #242 | Tragic 15.2% |
| Nicaraguans | 0.3 /100 | #243 | Tragic 15.3% |
| Ecuadorians | 0.3 /100 | #244 | Tragic 15.3% |
| Spanish American Indians | 0.3 /100 | #245 | Tragic 15.3% |
| Cubans | 0.3 /100 | #246 | Tragic 15.3% |
| Potawatomi | 0.3 /100 | #247 | Tragic 15.3% |
| Immigrants | Ghana | 0.3 /100 | #248 | Tragic 15.3% |
| Salvadorans | 0.3 /100 | #249 | Tragic 15.3% |
| Immigrants | Western Africa | 0.3 /100 | #250 | Tragic 15.3% |
| Immigrants | Trinidad and Tobago | 0.3 /100 | #251 | Tragic 15.4% |
| Immigrants | Burma/Myanmar | 0.3 /100 | #252 | Tragic 15.4% |
| Liberians | 0.2 /100 | #253 | Tragic 15.4% |
| Trinidadians and Tobagonians | 0.2 /100 | #254 | Tragic 15.4% |
| Ottawa | 0.2 /100 | #255 | Tragic 15.5% |
Demographics Similar to Chileans by Female Poverty
In terms of female poverty, the demographic groups most similar to Chileans are Peruvian (12.9%, a difference of 0.090%), French (12.9%, a difference of 0.17%), Immigrants from Switzerland (12.9%, a difference of 0.22%), Immigrants from France (12.9%, a difference of 0.22%), and Basque (12.9%, a difference of 0.31%).
| Demographics | Rating | Rank | Female Poverty |
| Immigrants | Vietnam | 87.1 /100 | #130 | Excellent 12.8% |
| Immigrants | Argentina | 87.0 /100 | #131 | Excellent 12.8% |
| Immigrants | Jordan | 86.9 /100 | #132 | Excellent 12.8% |
| Immigrants | Western Europe | 86.6 /100 | #133 | Excellent 12.8% |
| Immigrants | Switzerland | 85.8 /100 | #134 | Excellent 12.9% |
| French | 85.6 /100 | #135 | Excellent 12.9% |
| Peruvians | 85.2 /100 | #136 | Excellent 12.9% |
| Chileans | 84.7 /100 | #137 | Excellent 12.9% |
| Immigrants | France | 83.6 /100 | #138 | Excellent 12.9% |
| Basques | 83.1 /100 | #139 | Excellent 12.9% |
| Pakistanis | 83.0 /100 | #140 | Excellent 12.9% |
| Icelanders | 81.1 /100 | #141 | Excellent 13.0% |
| Brazilians | 80.5 /100 | #142 | Excellent 13.0% |
| Immigrants | Malaysia | 80.4 /100 | #143 | Excellent 13.0% |
| Afghans | 79.8 /100 | #144 | Good 13.0% |