Immigrants from Ghana vs Arab In Labor Force | Age 20-64
COMPARE
Immigrants from Ghana
Arab
In Labor Force | Age 20-64
In Labor Force | Age 20-64 Comparison
Immigrants from Ghana
Arabs
80.0%
IN LABOR FORCE | AGE 20-64
95.0/ 100
METRIC RATING
105th/ 347
METRIC RANK
79.2%
IN LABOR FORCE | AGE 20-64
11.4/ 100
METRIC RATING
216th/ 347
METRIC RANK
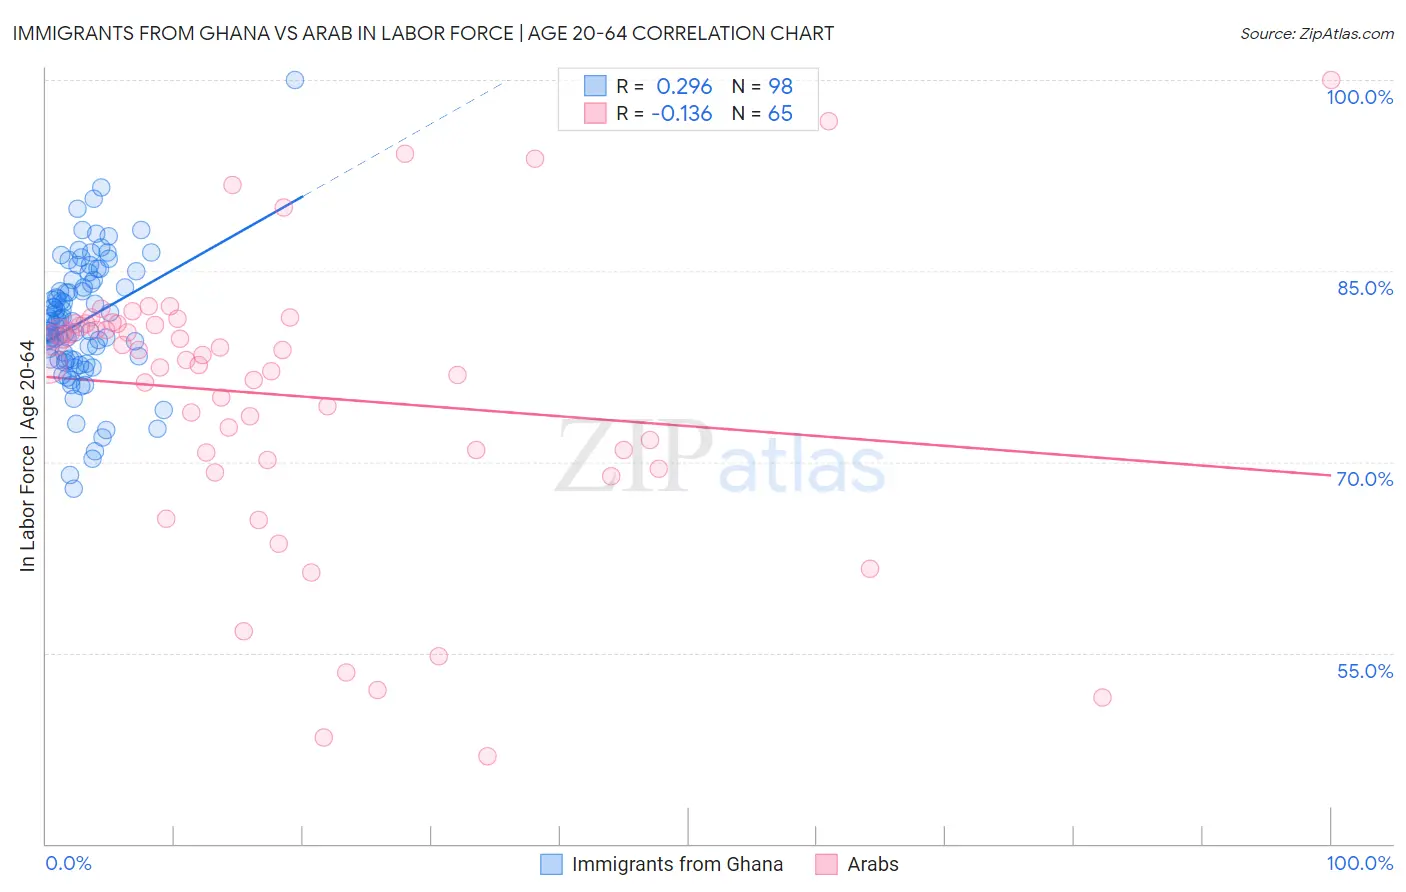
Immigrants from Ghana vs Arab In Labor Force | Age 20-64 Correlation Chart
The statistical analysis conducted on geographies consisting of 199,964,545 people shows a weak positive correlation between the proportion of Immigrants from Ghana and labor force participation rate among population between the ages 20 and 64 in the United States with a correlation coefficient (R) of 0.296 and weighted average of 80.0%. Similarly, the statistical analysis conducted on geographies consisting of 486,876,166 people shows a poor negative correlation between the proportion of Arabs and labor force participation rate among population between the ages 20 and 64 in the United States with a correlation coefficient (R) of -0.136 and weighted average of 79.2%, a difference of 1.0%.
In Labor Force | Age 20-64 Correlation Summary
| Measurement | Immigrants from Ghana | Arab |
| Minimum | 67.9% | 46.9% |
| Maximum | 100.0% | 100.0% |
| Range | 32.1% | 53.1% |
| Mean | 81.1% | 75.2% |
| Median | 81.0% | 78.0% |
| Interquartile 25% (IQ1) | 78.0% | 70.4% |
| Interquartile 75% (IQ3) | 84.3% | 80.8% |
| Interquartile Range (IQR) | 6.3% | 10.4% |
| Standard Deviation (Sample) | 5.1% | 11.1% |
| Standard Deviation (Population) | 5.0% | 11.0% |
Similar Demographics by In Labor Force | Age 20-64
Demographics Similar to Immigrants from Ghana by In Labor Force | Age 20-64
In terms of in labor force | age 20-64, the demographic groups most similar to Immigrants from Ghana are Venezuelan (80.0%, a difference of 0.010%), Greek (80.0%, a difference of 0.010%), Immigrants from Jordan (80.0%, a difference of 0.010%), Palestinian (80.0%, a difference of 0.020%), and Immigrants from Australia (80.0%, a difference of 0.020%).
| Demographics | Rating | Rank | In Labor Force | Age 20-64 |
| Immigrants | Uruguay | 95.8 /100 | #98 | Exceptional 80.1% |
| Immigrants | Chile | 95.7 /100 | #99 | Exceptional 80.1% |
| Filipinos | 95.6 /100 | #100 | Exceptional 80.1% |
| Palestinians | 95.5 /100 | #101 | Exceptional 80.0% |
| Immigrants | Australia | 95.5 /100 | #102 | Exceptional 80.0% |
| Russians | 95.5 /100 | #103 | Exceptional 80.0% |
| Venezuelans | 95.3 /100 | #104 | Exceptional 80.0% |
| Immigrants | Ghana | 95.0 /100 | #105 | Exceptional 80.0% |
| Greeks | 94.8 /100 | #106 | Exceptional 80.0% |
| Immigrants | Jordan | 94.8 /100 | #107 | Exceptional 80.0% |
| Iranians | 94.3 /100 | #108 | Exceptional 80.0% |
| Immigrants | Argentina | 94.1 /100 | #109 | Exceptional 80.0% |
| Estonians | 94.0 /100 | #110 | Exceptional 80.0% |
| Immigrants | South America | 93.9 /100 | #111 | Exceptional 80.0% |
| Immigrants | Italy | 93.9 /100 | #112 | Exceptional 80.0% |
Demographics Similar to Arabs by In Labor Force | Age 20-64
In terms of in labor force | age 20-64, the demographic groups most similar to Arabs are Immigrants from Armenia (79.2%, a difference of 0.010%), Immigrants from Norway (79.2%, a difference of 0.010%), Immigrants from Western Asia (79.2%, a difference of 0.010%), Irish (79.3%, a difference of 0.030%), and Immigrants from Portugal (79.3%, a difference of 0.030%).
| Demographics | Rating | Rank | In Labor Force | Age 20-64 |
| Bangladeshis | 16.4 /100 | #209 | Poor 79.3% |
| Haitians | 16.1 /100 | #210 | Poor 79.3% |
| Europeans | 15.3 /100 | #211 | Poor 79.3% |
| Irish | 13.2 /100 | #212 | Poor 79.3% |
| Immigrants | Portugal | 12.8 /100 | #213 | Poor 79.3% |
| Immigrants | Armenia | 12.2 /100 | #214 | Poor 79.2% |
| Immigrants | Norway | 12.0 /100 | #215 | Poor 79.2% |
| Arabs | 11.4 /100 | #216 | Poor 79.2% |
| Immigrants | Western Asia | 11.0 /100 | #217 | Poor 79.2% |
| Immigrants | England | 9.3 /100 | #218 | Tragic 79.2% |
| French Canadians | 8.4 /100 | #219 | Tragic 79.2% |
| Immigrants | Immigrants | 7.7 /100 | #220 | Tragic 79.2% |
| Hungarians | 7.2 /100 | #221 | Tragic 79.2% |
| Immigrants | Panama | 6.9 /100 | #222 | Tragic 79.1% |
| Canadians | 6.8 /100 | #223 | Tragic 79.1% |