Immigrants from Germany vs Somali Married-Couple Family Poverty
COMPARE
Immigrants from Germany
Somali
Married-Couple Family Poverty
Married-Couple Family Poverty Comparison
Immigrants from Germany
Somalis
4.7%
MARRIED-COUPLE FAMILY POVERTY
96.8/ 100
METRIC RATING
107th/ 347
METRIC RANK
5.8%
MARRIED-COUPLE FAMILY POVERTY
2.3/ 100
METRIC RATING
243rd/ 347
METRIC RANK
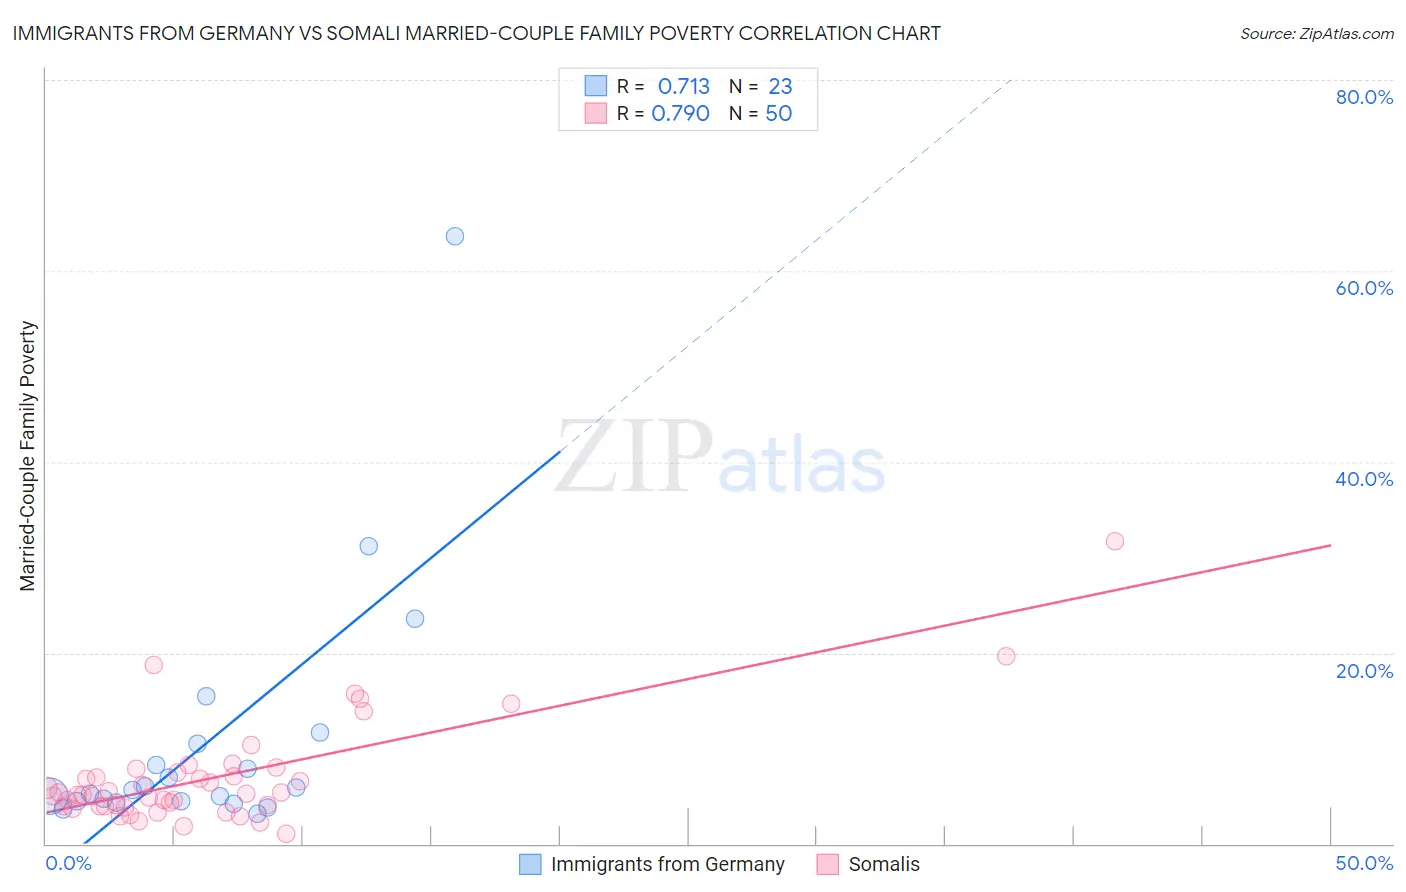
Immigrants from Germany vs Somali Married-Couple Family Poverty Correlation Chart
The statistical analysis conducted on geographies consisting of 458,355,071 people shows a strong positive correlation between the proportion of Immigrants from Germany and poverty level among married-couple families in the United States with a correlation coefficient (R) of 0.713 and weighted average of 4.7%. Similarly, the statistical analysis conducted on geographies consisting of 99,100,573 people shows a strong positive correlation between the proportion of Somalis and poverty level among married-couple families in the United States with a correlation coefficient (R) of 0.790 and weighted average of 5.8%, a difference of 23.2%.
Married-Couple Family Poverty Correlation Summary
| Measurement | Immigrants from Germany | Somali |
| Minimum | 3.1% | 1.1% |
| Maximum | 63.6% | 31.7% |
| Range | 60.5% | 30.7% |
| Mean | 10.6% | 7.0% |
| Median | 5.6% | 5.2% |
| Interquartile 25% (IQ1) | 4.4% | 3.9% |
| Interquartile 75% (IQ3) | 10.5% | 7.5% |
| Interquartile Range (IQR) | 6.1% | 3.6% |
| Standard Deviation (Sample) | 13.4% | 5.5% |
| Standard Deviation (Population) | 13.1% | 5.4% |
Similar Demographics by Married-Couple Family Poverty
Demographics Similar to Immigrants from Germany by Married-Couple Family Poverty
In terms of married-couple family poverty, the demographic groups most similar to Immigrants from Germany are Immigrants from France (4.7%, a difference of 0.010%), Aleut (4.7%, a difference of 0.16%), Immigrants from Moldova (4.7%, a difference of 0.24%), Laotian (4.7%, a difference of 0.26%), and Immigrants from Hong Kong (4.7%, a difference of 0.46%).
| Demographics | Rating | Rank | Married-Couple Family Poverty |
| Immigrants | Western Europe | 97.9 /100 | #100 | Exceptional 4.6% |
| Yugoslavians | 97.8 /100 | #101 | Exceptional 4.6% |
| Asians | 97.6 /100 | #102 | Exceptional 4.7% |
| Immigrants | Romania | 97.3 /100 | #103 | Exceptional 4.7% |
| Immigrants | Moldova | 97.1 /100 | #104 | Exceptional 4.7% |
| Aleuts | 97.0 /100 | #105 | Exceptional 4.7% |
| Immigrants | France | 96.9 /100 | #106 | Exceptional 4.7% |
| Immigrants | Germany | 96.8 /100 | #107 | Exceptional 4.7% |
| Laotians | 96.6 /100 | #108 | Exceptional 4.7% |
| Immigrants | Hong Kong | 96.4 /100 | #109 | Exceptional 4.7% |
| Immigrants | Bolivia | 96.2 /100 | #110 | Exceptional 4.7% |
| Pakistanis | 96.2 /100 | #111 | Exceptional 4.7% |
| Tongans | 95.9 /100 | #112 | Exceptional 4.7% |
| Immigrants | Nepal | 95.9 /100 | #113 | Exceptional 4.7% |
| Immigrants | Indonesia | 95.1 /100 | #114 | Exceptional 4.8% |
Demographics Similar to Somalis by Married-Couple Family Poverty
In terms of married-couple family poverty, the demographic groups most similar to Somalis are Chickasaw (5.8%, a difference of 0.010%), Immigrants from Western Africa (5.8%, a difference of 0.16%), Immigrants from Afghanistan (5.8%, a difference of 0.16%), Immigrants from Panama (5.8%, a difference of 0.24%), and Fijian (5.8%, a difference of 0.27%).
| Demographics | Rating | Rank | Married-Couple Family Poverty |
| Ghanaians | 3.3 /100 | #236 | Tragic 5.7% |
| Immigrants | South America | 3.1 /100 | #237 | Tragic 5.7% |
| Cherokee | 2.7 /100 | #238 | Tragic 5.8% |
| Venezuelans | 2.7 /100 | #239 | Tragic 5.8% |
| Fijians | 2.5 /100 | #240 | Tragic 5.8% |
| Immigrants | Panama | 2.5 /100 | #241 | Tragic 5.8% |
| Immigrants | Western Africa | 2.4 /100 | #242 | Tragic 5.8% |
| Somalis | 2.3 /100 | #243 | Tragic 5.8% |
| Chickasaw | 2.3 /100 | #244 | Tragic 5.8% |
| Immigrants | Afghanistan | 2.1 /100 | #245 | Tragic 5.8% |
| Immigrants | Venezuela | 1.8 /100 | #246 | Tragic 5.8% |
| Iraqis | 1.4 /100 | #247 | Tragic 5.9% |
| Cree | 1.2 /100 | #248 | Tragic 5.9% |
| Tsimshian | 1.1 /100 | #249 | Tragic 5.9% |
| Immigrants | Eritrea | 1.1 /100 | #250 | Tragic 5.9% |