Immigrants from Germany vs Somali Male Unemployment
COMPARE
Immigrants from Germany
Somali
Male Unemployment
Male Unemployment Comparison
Immigrants from Germany
Somalis
5.2%
MALE UNEMPLOYMENT
83.0/ 100
METRIC RATING
131st/ 347
METRIC RANK
5.6%
MALE UNEMPLOYMENT
1.5/ 100
METRIC RATING
233rd/ 347
METRIC RANK
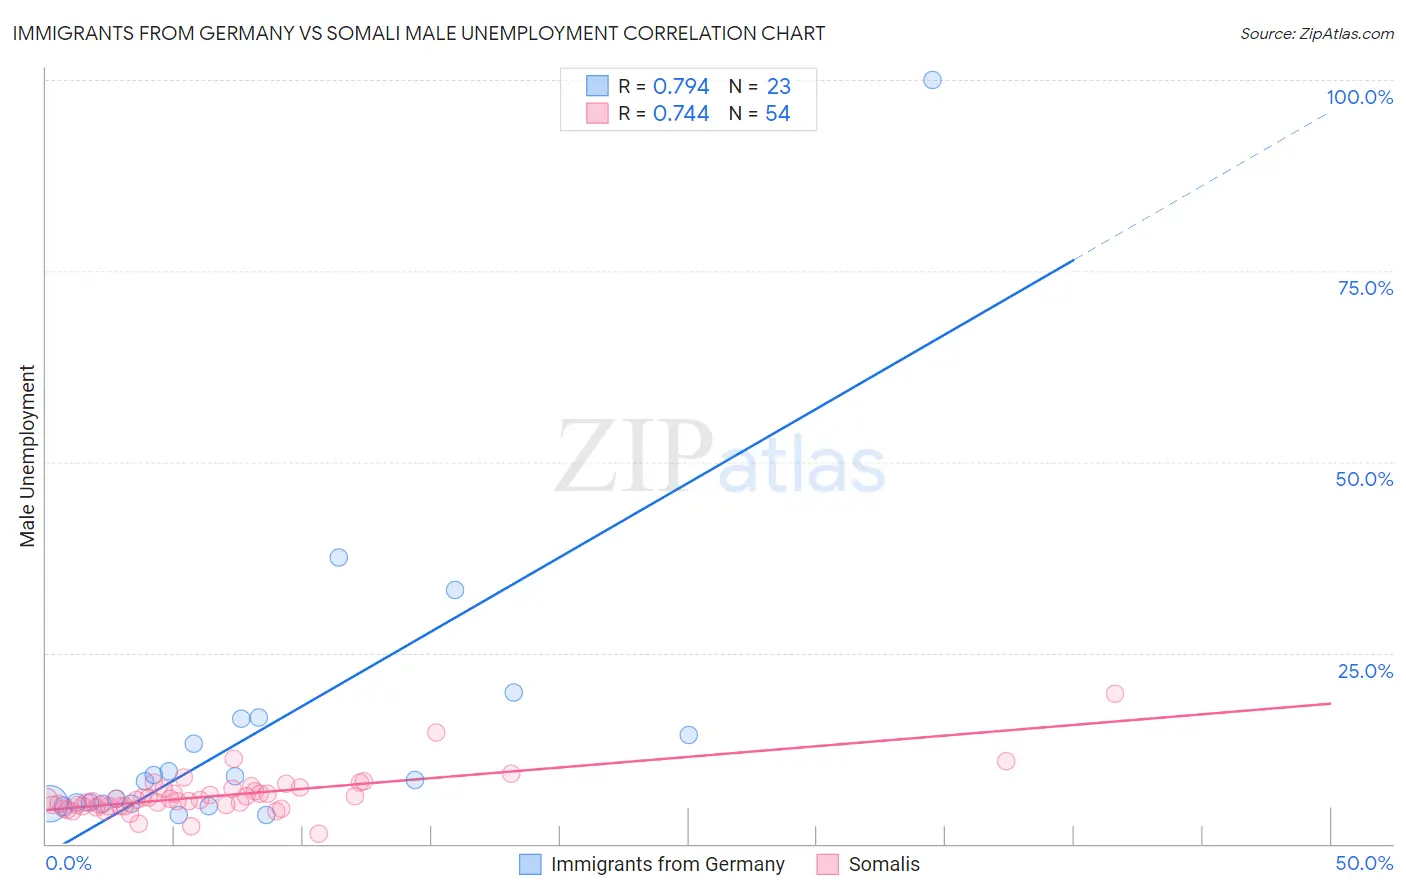
Immigrants from Germany vs Somali Male Unemployment Correlation Chart
The statistical analysis conducted on geographies consisting of 460,829,460 people shows a strong positive correlation between the proportion of Immigrants from Germany and unemployment rate among males in the United States with a correlation coefficient (R) of 0.794 and weighted average of 5.2%. Similarly, the statistical analysis conducted on geographies consisting of 99,217,448 people shows a strong positive correlation between the proportion of Somalis and unemployment rate among males in the United States with a correlation coefficient (R) of 0.744 and weighted average of 5.6%, a difference of 8.6%.
Male Unemployment Correlation Summary
| Measurement | Immigrants from Germany | Somali |
| Minimum | 3.8% | 1.3% |
| Maximum | 100.0% | 19.7% |
| Range | 96.2% | 18.4% |
| Mean | 15.0% | 6.3% |
| Median | 8.3% | 5.8% |
| Interquartile 25% (IQ1) | 5.2% | 4.9% |
| Interquartile 75% (IQ3) | 16.4% | 7.1% |
| Interquartile Range (IQR) | 11.2% | 2.2% |
| Standard Deviation (Sample) | 20.6% | 2.8% |
| Standard Deviation (Population) | 20.1% | 2.8% |
Similar Demographics by Male Unemployment
Demographics Similar to Immigrants from Germany by Male Unemployment
In terms of male unemployment, the demographic groups most similar to Immigrants from Germany are Chickasaw (5.2%, a difference of 0.020%), Immigrants from Malaysia (5.2%, a difference of 0.050%), Immigrants from Western Europe (5.2%, a difference of 0.20%), Colombian (5.2%, a difference of 0.20%), and Hungarian (5.2%, a difference of 0.23%).
| Demographics | Rating | Rank | Male Unemployment |
| Immigrants | Latvia | 87.5 /100 | #124 | Excellent 5.1% |
| Immigrants | Lithuania | 87.2 /100 | #125 | Excellent 5.1% |
| Immigrants | Colombia | 86.8 /100 | #126 | Excellent 5.1% |
| Immigrants | Brazil | 86.3 /100 | #127 | Excellent 5.2% |
| Hungarians | 85.1 /100 | #128 | Excellent 5.2% |
| Immigrants | Western Europe | 84.8 /100 | #129 | Excellent 5.2% |
| Immigrants | Malaysia | 83.5 /100 | #130 | Excellent 5.2% |
| Immigrants | Germany | 83.0 /100 | #131 | Excellent 5.2% |
| Chickasaw | 82.9 /100 | #132 | Excellent 5.2% |
| Colombians | 81.1 /100 | #133 | Excellent 5.2% |
| Pakistanis | 80.5 /100 | #134 | Excellent 5.2% |
| Immigrants | Saudi Arabia | 80.1 /100 | #135 | Excellent 5.2% |
| Lebanese | 79.9 /100 | #136 | Good 5.2% |
| Immigrants | Eastern Africa | 79.8 /100 | #137 | Good 5.2% |
| Immigrants | Croatia | 79.7 /100 | #138 | Good 5.2% |
Demographics Similar to Somalis by Male Unemployment
In terms of male unemployment, the demographic groups most similar to Somalis are Immigrants from Somalia (5.6%, a difference of 0.0%), Immigrants from Honduras (5.6%, a difference of 0.030%), Moroccan (5.6%, a difference of 0.080%), Choctaw (5.6%, a difference of 0.11%), and Immigrants from Africa (5.6%, a difference of 0.16%).
| Demographics | Rating | Rank | Male Unemployment |
| Immigrants | Cambodia | 1.8 /100 | #226 | Tragic 5.6% |
| Immigrants | Panama | 1.8 /100 | #227 | Tragic 5.6% |
| Seminole | 1.8 /100 | #228 | Tragic 5.6% |
| Central Americans | 1.8 /100 | #229 | Tragic 5.6% |
| Immigrants | Africa | 1.7 /100 | #230 | Tragic 5.6% |
| Choctaw | 1.6 /100 | #231 | Tragic 5.6% |
| Moroccans | 1.6 /100 | #232 | Tragic 5.6% |
| Somalis | 1.5 /100 | #233 | Tragic 5.6% |
| Immigrants | Somalia | 1.5 /100 | #234 | Tragic 5.6% |
| Immigrants | Honduras | 1.5 /100 | #235 | Tragic 5.6% |
| Guatemalans | 1.2 /100 | #236 | Tragic 5.6% |
| Hondurans | 1.1 /100 | #237 | Tragic 5.6% |
| Native Hawaiians | 1.1 /100 | #238 | Tragic 5.6% |
| Immigrants | Guatemala | 1.1 /100 | #239 | Tragic 5.6% |
| Immigrants | Cameroon | 1.0 /100 | #240 | Tragic 5.6% |