Immigrants from Eritrea vs Immigrants from Zaire Poverty
COMPARE
Immigrants from Eritrea
Immigrants from Zaire
Poverty
Poverty Comparison
Immigrants from Eritrea
Immigrants from Zaire
13.4%
POVERTY
2.4/ 100
METRIC RATING
224th/ 347
METRIC RANK
15.1%
POVERTY
0.0/ 100
METRIC RATING
293rd/ 347
METRIC RANK
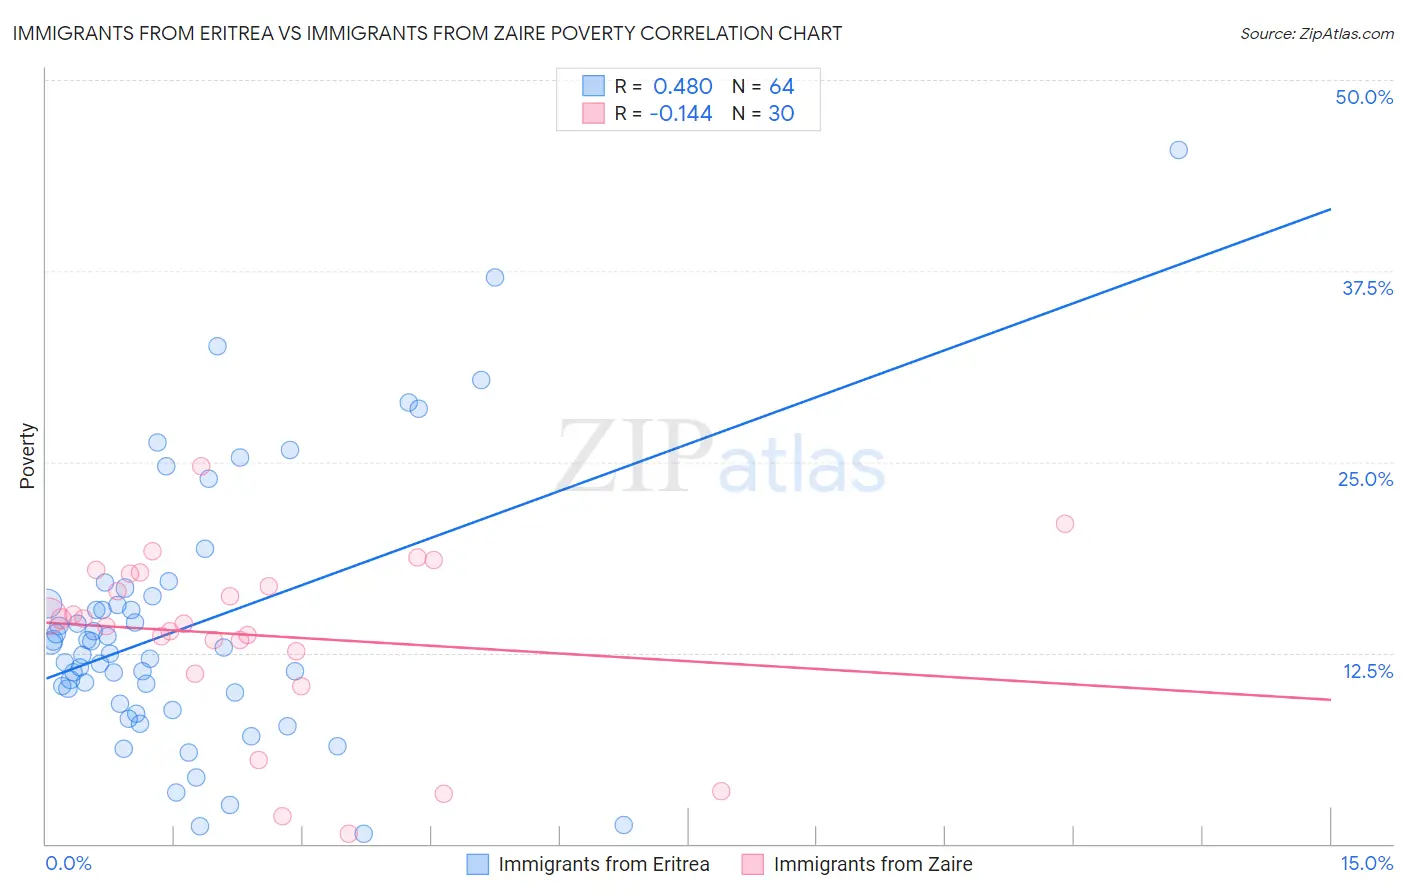
Immigrants from Eritrea vs Immigrants from Zaire Poverty Correlation Chart
The statistical analysis conducted on geographies consisting of 104,846,826 people shows a moderate positive correlation between the proportion of Immigrants from Eritrea and poverty level in the United States with a correlation coefficient (R) of 0.480 and weighted average of 13.4%. Similarly, the statistical analysis conducted on geographies consisting of 107,241,785 people shows a poor negative correlation between the proportion of Immigrants from Zaire and poverty level in the United States with a correlation coefficient (R) of -0.144 and weighted average of 15.1%, a difference of 12.7%.
Poverty Correlation Summary
| Measurement | Immigrants from Eritrea | Immigrants from Zaire |
| Minimum | 0.62% | 0.62% |
| Maximum | 45.5% | 24.7% |
| Range | 44.8% | 24.1% |
| Mean | 14.2% | 13.7% |
| Median | 12.6% | 14.6% |
| Interquartile 25% (IQ1) | 9.5% | 12.6% |
| Interquartile 75% (IQ3) | 16.0% | 17.7% |
| Interquartile Range (IQR) | 6.4% | 5.1% |
| Standard Deviation (Sample) | 8.6% | 5.7% |
| Standard Deviation (Population) | 8.5% | 5.6% |
Similar Demographics by Poverty
Demographics Similar to Immigrants from Eritrea by Poverty
In terms of poverty, the demographic groups most similar to Immigrants from Eritrea are Immigrants from Africa (13.4%, a difference of 0.10%), Immigrants from Micronesia (13.4%, a difference of 0.14%), Alsatian (13.4%, a difference of 0.18%), German Russian (13.4%, a difference of 0.22%), and Marshallese (13.4%, a difference of 0.23%).
| Demographics | Rating | Rank | Poverty |
| Immigrants | Uzbekistan | 3.2 /100 | #217 | Tragic 13.3% |
| Immigrants | Thailand | 3.1 /100 | #218 | Tragic 13.3% |
| Immigrants | Cambodia | 3.0 /100 | #219 | Tragic 13.4% |
| Americans | 2.9 /100 | #220 | Tragic 13.4% |
| Alsatians | 2.6 /100 | #221 | Tragic 13.4% |
| Immigrants | Micronesia | 2.6 /100 | #222 | Tragic 13.4% |
| Immigrants | Africa | 2.5 /100 | #223 | Tragic 13.4% |
| Immigrants | Eritrea | 2.4 /100 | #224 | Tragic 13.4% |
| German Russians | 2.2 /100 | #225 | Tragic 13.4% |
| Marshallese | 2.2 /100 | #226 | Tragic 13.4% |
| Alaska Natives | 2.1 /100 | #227 | Tragic 13.5% |
| Immigrants | Nigeria | 1.7 /100 | #228 | Tragic 13.5% |
| Osage | 1.5 /100 | #229 | Tragic 13.6% |
| Alaskan Athabascans | 1.5 /100 | #230 | Tragic 13.6% |
| Nigerians | 1.4 /100 | #231 | Tragic 13.6% |
Demographics Similar to Immigrants from Zaire by Poverty
In terms of poverty, the demographic groups most similar to Immigrants from Zaire are Indonesian (15.1%, a difference of 0.010%), Immigrants from Cabo Verde (15.1%, a difference of 0.060%), Mexican (15.1%, a difference of 0.18%), Immigrants from Belize (15.1%, a difference of 0.29%), and Yaqui (15.1%, a difference of 0.40%).
| Demographics | Rating | Rank | Poverty |
| Immigrants | Latin America | 0.0 /100 | #286 | Tragic 15.0% |
| Inupiat | 0.0 /100 | #287 | Tragic 15.1% |
| Yaqui | 0.0 /100 | #288 | Tragic 15.1% |
| Immigrants | Belize | 0.0 /100 | #289 | Tragic 15.1% |
| Mexicans | 0.0 /100 | #290 | Tragic 15.1% |
| Immigrants | Cabo Verde | 0.0 /100 | #291 | Tragic 15.1% |
| Indonesians | 0.0 /100 | #292 | Tragic 15.1% |
| Immigrants | Zaire | 0.0 /100 | #293 | Tragic 15.1% |
| Blackfeet | 0.0 /100 | #294 | Tragic 15.2% |
| Guatemalans | 0.0 /100 | #295 | Tragic 15.3% |
| Hispanics or Latinos | 0.0 /100 | #296 | Tragic 15.3% |
| Immigrants | Bangladesh | 0.0 /100 | #297 | Tragic 15.3% |
| Immigrants | Senegal | 0.0 /100 | #298 | Tragic 15.3% |
| Senegalese | 0.0 /100 | #299 | Tragic 15.3% |
| Immigrants | Central America | 0.0 /100 | #300 | Tragic 15.4% |