Immigrants from Eritrea vs Finnish Poverty
COMPARE
Immigrants from Eritrea
Finnish
Poverty
Poverty Comparison
Immigrants from Eritrea
Finns
13.4%
POVERTY
2.4/ 100
METRIC RATING
224th/ 347
METRIC RANK
11.4%
POVERTY
95.2/ 100
METRIC RATING
91st/ 347
METRIC RANK
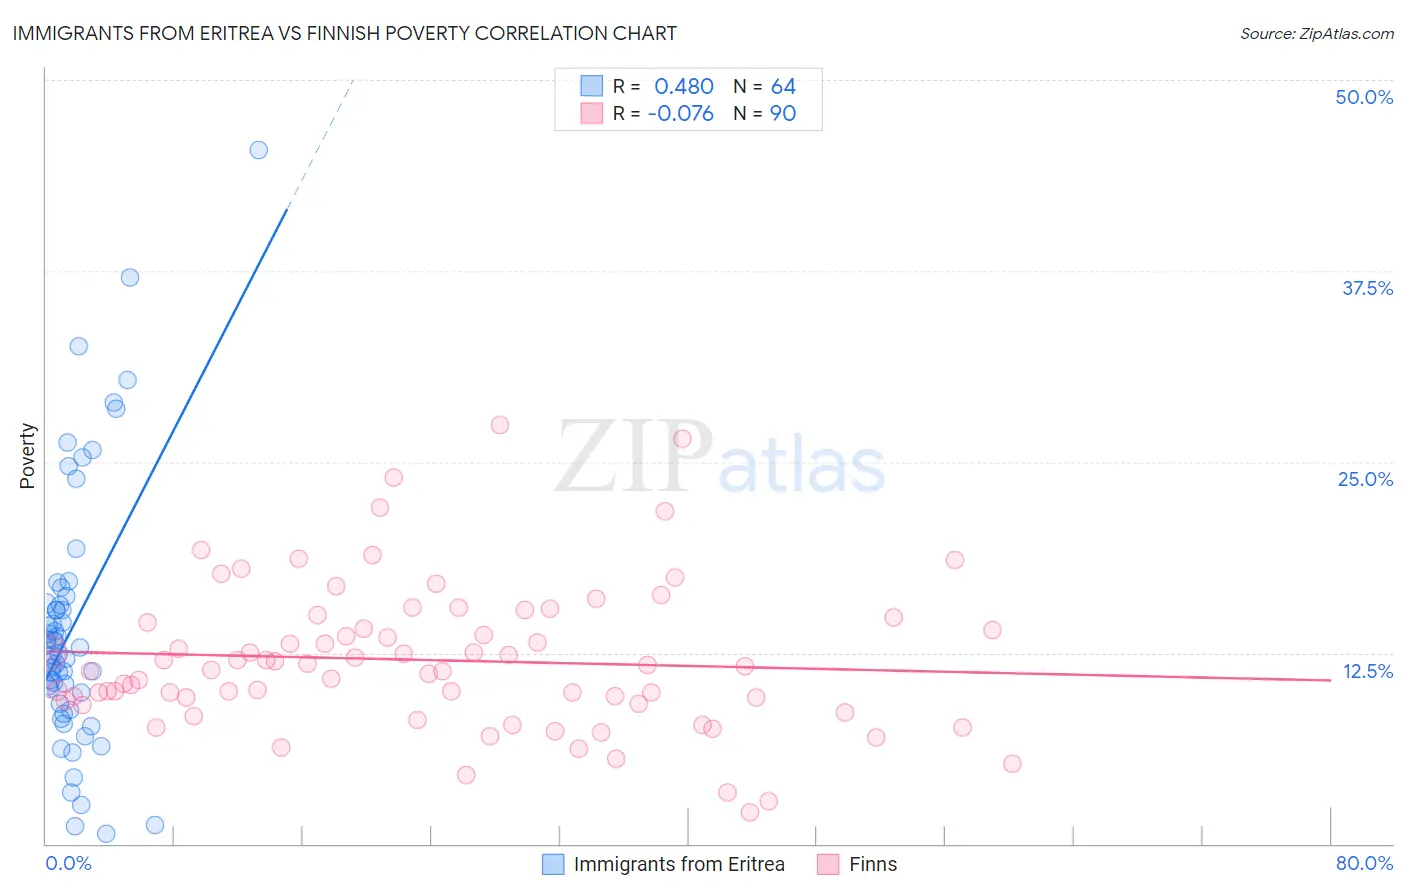
Immigrants from Eritrea vs Finnish Poverty Correlation Chart
The statistical analysis conducted on geographies consisting of 104,846,826 people shows a moderate positive correlation between the proportion of Immigrants from Eritrea and poverty level in the United States with a correlation coefficient (R) of 0.480 and weighted average of 13.4%. Similarly, the statistical analysis conducted on geographies consisting of 404,501,473 people shows a slight negative correlation between the proportion of Finns and poverty level in the United States with a correlation coefficient (R) of -0.076 and weighted average of 11.4%, a difference of 17.5%.
Poverty Correlation Summary
| Measurement | Immigrants from Eritrea | Finnish |
| Minimum | 0.62% | 2.0% |
| Maximum | 45.5% | 27.4% |
| Range | 44.8% | 25.4% |
| Mean | 14.2% | 12.0% |
| Median | 12.6% | 11.5% |
| Interquartile 25% (IQ1) | 9.5% | 9.4% |
| Interquartile 75% (IQ3) | 16.0% | 14.5% |
| Interquartile Range (IQR) | 6.4% | 5.1% |
| Standard Deviation (Sample) | 8.6% | 4.8% |
| Standard Deviation (Population) | 8.5% | 4.8% |
Similar Demographics by Poverty
Demographics Similar to Immigrants from Eritrea by Poverty
In terms of poverty, the demographic groups most similar to Immigrants from Eritrea are Immigrants from Africa (13.4%, a difference of 0.10%), Immigrants from Micronesia (13.4%, a difference of 0.14%), Alsatian (13.4%, a difference of 0.18%), German Russian (13.4%, a difference of 0.22%), and Marshallese (13.4%, a difference of 0.23%).
| Demographics | Rating | Rank | Poverty |
| Immigrants | Uzbekistan | 3.2 /100 | #217 | Tragic 13.3% |
| Immigrants | Thailand | 3.1 /100 | #218 | Tragic 13.3% |
| Immigrants | Cambodia | 3.0 /100 | #219 | Tragic 13.4% |
| Americans | 2.9 /100 | #220 | Tragic 13.4% |
| Alsatians | 2.6 /100 | #221 | Tragic 13.4% |
| Immigrants | Micronesia | 2.6 /100 | #222 | Tragic 13.4% |
| Immigrants | Africa | 2.5 /100 | #223 | Tragic 13.4% |
| Immigrants | Eritrea | 2.4 /100 | #224 | Tragic 13.4% |
| German Russians | 2.2 /100 | #225 | Tragic 13.4% |
| Marshallese | 2.2 /100 | #226 | Tragic 13.4% |
| Alaska Natives | 2.1 /100 | #227 | Tragic 13.5% |
| Immigrants | Nigeria | 1.7 /100 | #228 | Tragic 13.5% |
| Osage | 1.5 /100 | #229 | Tragic 13.6% |
| Alaskan Athabascans | 1.5 /100 | #230 | Tragic 13.6% |
| Nigerians | 1.4 /100 | #231 | Tragic 13.6% |
Demographics Similar to Finns by Poverty
In terms of poverty, the demographic groups most similar to Finns are Immigrants from Denmark (11.4%, a difference of 0.13%), British (11.4%, a difference of 0.14%), Romanian (11.4%, a difference of 0.17%), Paraguayan (11.4%, a difference of 0.19%), and Australian (11.4%, a difference of 0.20%).
| Demographics | Rating | Rank | Poverty |
| English | 96.3 /100 | #84 | Exceptional 11.3% |
| Immigrants | England | 96.2 /100 | #85 | Exceptional 11.4% |
| Jordanians | 96.0 /100 | #86 | Exceptional 11.4% |
| Northern Europeans | 96.0 /100 | #87 | Exceptional 11.4% |
| Belgians | 95.8 /100 | #88 | Exceptional 11.4% |
| Czechoslovakians | 95.7 /100 | #89 | Exceptional 11.4% |
| Immigrants | Denmark | 95.5 /100 | #90 | Exceptional 11.4% |
| Finns | 95.2 /100 | #91 | Exceptional 11.4% |
| British | 95.0 /100 | #92 | Exceptional 11.4% |
| Romanians | 94.9 /100 | #93 | Exceptional 11.4% |
| Paraguayans | 94.9 /100 | #94 | Exceptional 11.4% |
| Australians | 94.9 /100 | #95 | Exceptional 11.4% |
| Immigrants | South Africa | 94.7 /100 | #96 | Exceptional 11.5% |
| Immigrants | Egypt | 94.6 /100 | #97 | Exceptional 11.5% |
| Immigrants | Latvia | 94.5 /100 | #98 | Exceptional 11.5% |