Immigrants from Eritrea vs Immigrants from Western Asia Poverty
COMPARE
Immigrants from Eritrea
Immigrants from Western Asia
Poverty
Poverty Comparison
Immigrants from Eritrea
Immigrants from Western Asia
13.4%
POVERTY
2.4/ 100
METRIC RATING
224th/ 347
METRIC RANK
12.9%
POVERTY
14.1/ 100
METRIC RATING
204th/ 347
METRIC RANK
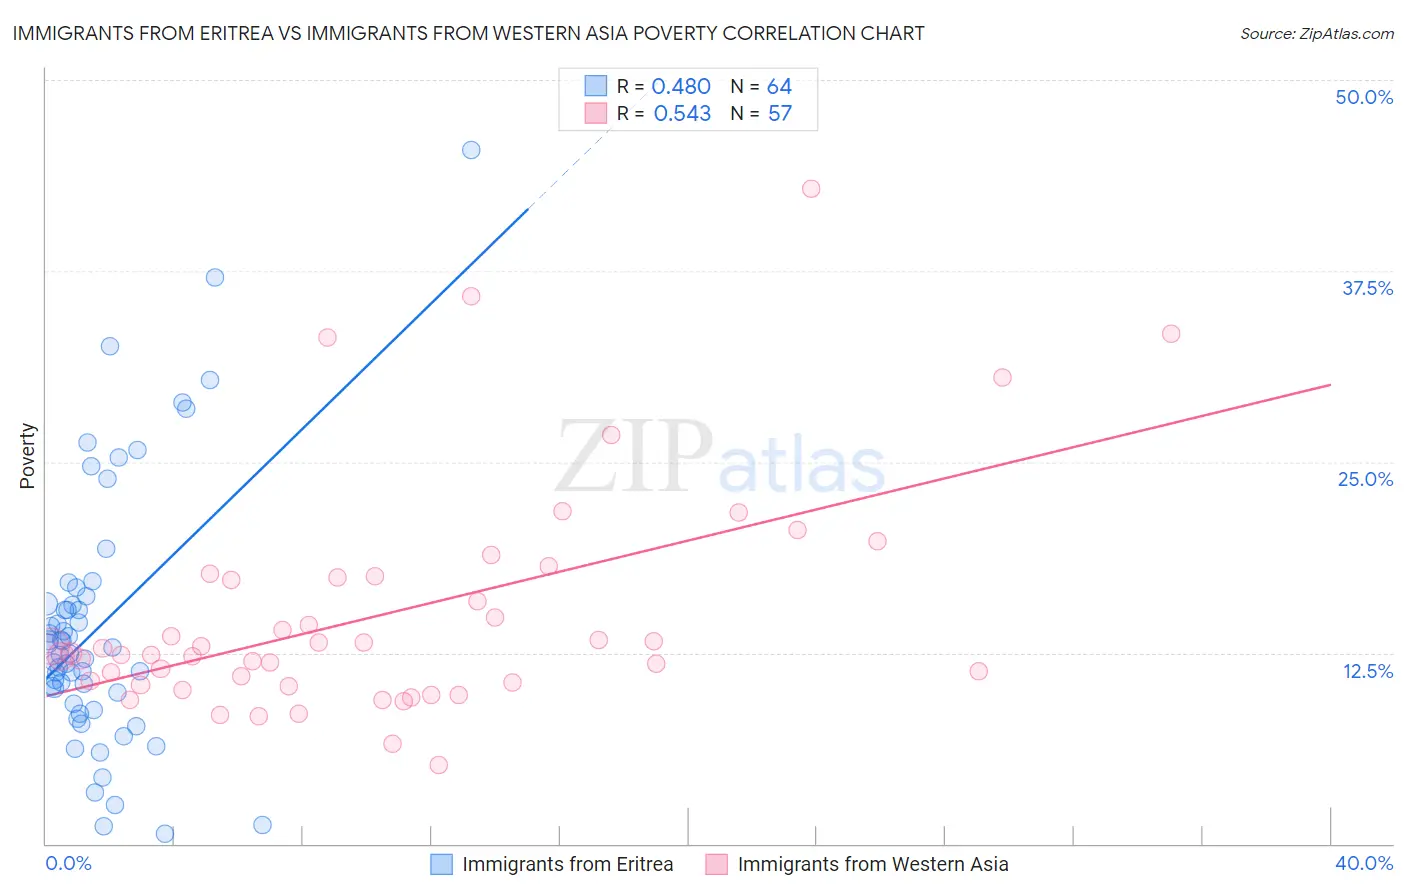
Immigrants from Eritrea vs Immigrants from Western Asia Poverty Correlation Chart
The statistical analysis conducted on geographies consisting of 104,846,826 people shows a moderate positive correlation between the proportion of Immigrants from Eritrea and poverty level in the United States with a correlation coefficient (R) of 0.480 and weighted average of 13.4%. Similarly, the statistical analysis conducted on geographies consisting of 404,214,361 people shows a substantial positive correlation between the proportion of Immigrants from Western Asia and poverty level in the United States with a correlation coefficient (R) of 0.543 and weighted average of 12.9%, a difference of 4.4%.
Poverty Correlation Summary
| Measurement | Immigrants from Eritrea | Immigrants from Western Asia |
| Minimum | 0.62% | 5.2% |
| Maximum | 45.5% | 42.9% |
| Range | 44.8% | 37.7% |
| Mean | 14.2% | 15.1% |
| Median | 12.6% | 12.5% |
| Interquartile 25% (IQ1) | 9.5% | 10.5% |
| Interquartile 75% (IQ3) | 16.0% | 17.5% |
| Interquartile Range (IQR) | 6.4% | 7.0% |
| Standard Deviation (Sample) | 8.6% | 7.6% |
| Standard Deviation (Population) | 8.5% | 7.5% |
Demographics Similar to Immigrants from Eritrea and Immigrants from Western Asia by Poverty
In terms of poverty, the demographic groups most similar to Immigrants from Eritrea are Immigrants from Africa (13.4%, a difference of 0.10%), Immigrants from Micronesia (13.4%, a difference of 0.14%), Alsatian (13.4%, a difference of 0.18%), American (13.4%, a difference of 0.38%), and Immigrants from Cambodia (13.4%, a difference of 0.47%). Similarly, the demographic groups most similar to Immigrants from Western Asia are Tsimshian (13.0%, a difference of 1.1%), Immigrants from Eastern Africa (13.1%, a difference of 1.8%), Panamanian (13.1%, a difference of 2.0%), Ugandan (13.1%, a difference of 2.1%), and Malaysian (13.1%, a difference of 2.1%).
| Demographics | Rating | Rank | Poverty |
| Immigrants | Western Asia | 14.1 /100 | #204 | Poor 12.9% |
| Tsimshian | 9.2 /100 | #205 | Tragic 13.0% |
| Immigrants | Eastern Africa | 7.0 /100 | #206 | Tragic 13.1% |
| Panamanians | 6.6 /100 | #207 | Tragic 13.1% |
| Ugandans | 6.2 /100 | #208 | Tragic 13.1% |
| Malaysians | 6.1 /100 | #209 | Tragic 13.1% |
| Immigrants | Azores | 6.1 /100 | #210 | Tragic 13.1% |
| Moroccans | 5.2 /100 | #211 | Tragic 13.2% |
| Immigrants | Immigrants | 4.3 /100 | #212 | Tragic 13.2% |
| Immigrants | Panama | 4.1 /100 | #213 | Tragic 13.3% |
| Bermudans | 3.7 /100 | #214 | Tragic 13.3% |
| Japanese | 3.3 /100 | #215 | Tragic 13.3% |
| Immigrants | Nonimmigrants | 3.3 /100 | #216 | Tragic 13.3% |
| Immigrants | Uzbekistan | 3.2 /100 | #217 | Tragic 13.3% |
| Immigrants | Thailand | 3.1 /100 | #218 | Tragic 13.3% |
| Immigrants | Cambodia | 3.0 /100 | #219 | Tragic 13.4% |
| Americans | 2.9 /100 | #220 | Tragic 13.4% |
| Alsatians | 2.6 /100 | #221 | Tragic 13.4% |
| Immigrants | Micronesia | 2.6 /100 | #222 | Tragic 13.4% |
| Immigrants | Africa | 2.5 /100 | #223 | Tragic 13.4% |
| Immigrants | Eritrea | 2.4 /100 | #224 | Tragic 13.4% |