Immigrants from El Salvador vs Iraqi Bachelor's Degree
COMPARE
Immigrants from El Salvador
Iraqi
Bachelor's Degree
Bachelor's Degree Comparison
Immigrants from El Salvador
Iraqis
31.3%
BACHELOR'S DEGREE
0.1/ 100
METRIC RATING
286th/ 347
METRIC RANK
39.0%
BACHELOR'S DEGREE
78.1/ 100
METRIC RATING
148th/ 347
METRIC RANK
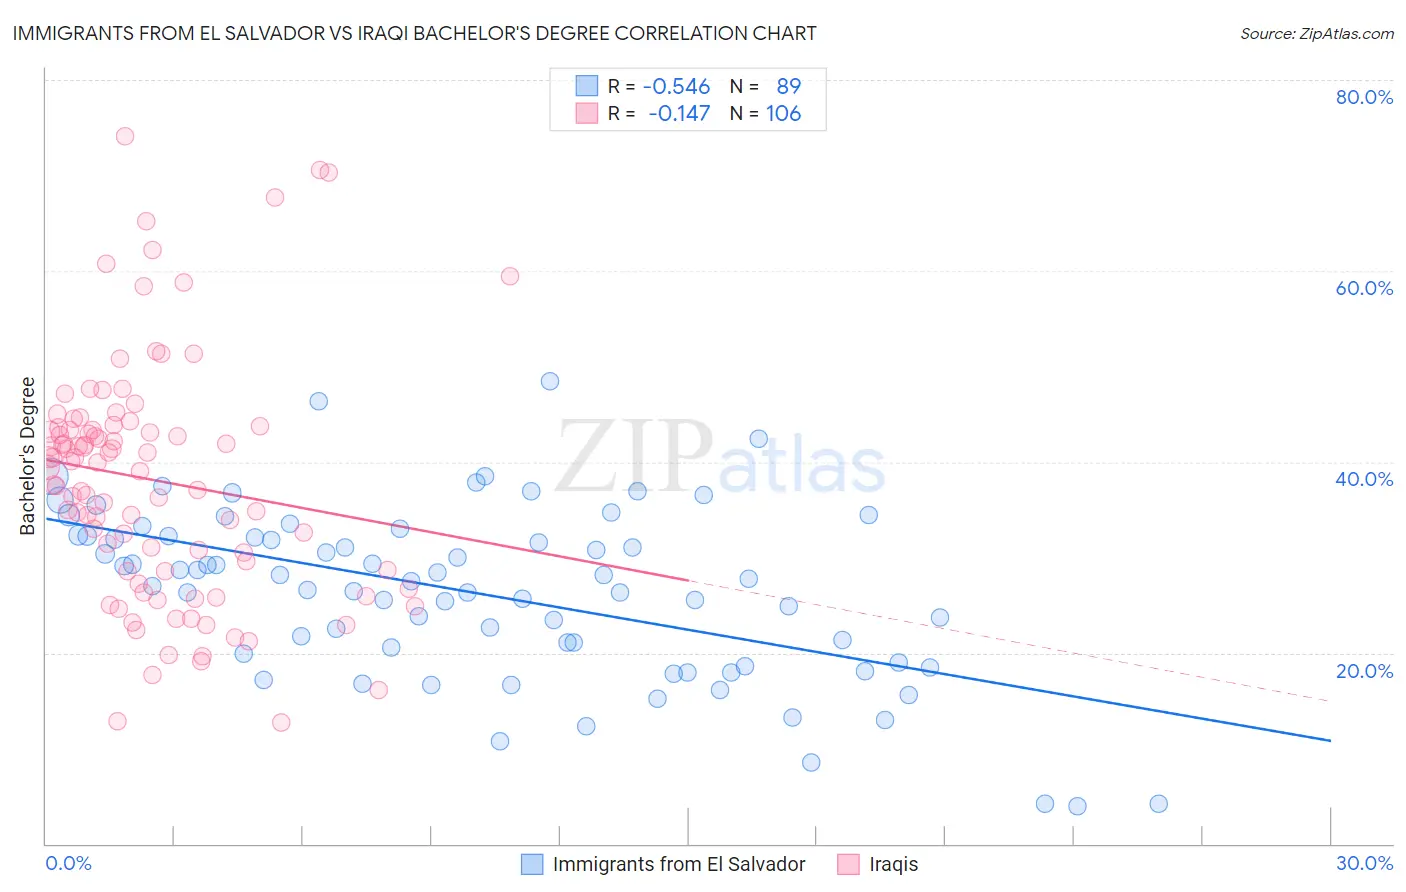
Immigrants from El Salvador vs Iraqi Bachelor's Degree Correlation Chart
The statistical analysis conducted on geographies consisting of 357,832,054 people shows a substantial negative correlation between the proportion of Immigrants from El Salvador and percentage of population with at least bachelor's degree education in the United States with a correlation coefficient (R) of -0.546 and weighted average of 31.3%. Similarly, the statistical analysis conducted on geographies consisting of 170,654,288 people shows a poor negative correlation between the proportion of Iraqis and percentage of population with at least bachelor's degree education in the United States with a correlation coefficient (R) of -0.147 and weighted average of 39.0%, a difference of 24.6%.
Bachelor's Degree Correlation Summary
| Measurement | Immigrants from El Salvador | Iraqi |
| Minimum | 3.9% | 12.8% |
| Maximum | 48.5% | 74.1% |
| Range | 44.6% | 61.3% |
| Mean | 26.3% | 38.1% |
| Median | 27.5% | 39.7% |
| Interquartile 25% (IQ1) | 19.4% | 28.6% |
| Interquartile 75% (IQ3) | 32.2% | 43.6% |
| Interquartile Range (IQR) | 12.8% | 15.0% |
| Standard Deviation (Sample) | 9.0% | 12.6% |
| Standard Deviation (Population) | 8.9% | 12.5% |
Similar Demographics by Bachelor's Degree
Demographics Similar to Immigrants from El Salvador by Bachelor's Degree
In terms of bachelor's degree, the demographic groups most similar to Immigrants from El Salvador are Aleut (31.3%, a difference of 0.050%), Haitian (31.3%, a difference of 0.070%), Honduran (31.3%, a difference of 0.10%), Immigrants from Caribbean (31.4%, a difference of 0.38%), and Blackfeet (31.5%, a difference of 0.52%).
| Demographics | Rating | Rank | Bachelor's Degree |
| Hawaiians | 0.1 /100 | #279 | Tragic 31.6% |
| Immigrants | Laos | 0.1 /100 | #280 | Tragic 31.6% |
| Blackfeet | 0.1 /100 | #281 | Tragic 31.5% |
| Immigrants | Caribbean | 0.1 /100 | #282 | Tragic 31.4% |
| Hondurans | 0.1 /100 | #283 | Tragic 31.3% |
| Haitians | 0.1 /100 | #284 | Tragic 31.3% |
| Aleuts | 0.1 /100 | #285 | Tragic 31.3% |
| Immigrants | El Salvador | 0.1 /100 | #286 | Tragic 31.3% |
| Ottawa | 0.1 /100 | #287 | Tragic 31.1% |
| Guatemalans | 0.1 /100 | #288 | Tragic 31.0% |
| Puerto Ricans | 0.1 /100 | #289 | Tragic 31.0% |
| Immigrants | Honduras | 0.1 /100 | #290 | Tragic 30.9% |
| Blacks/African Americans | 0.1 /100 | #291 | Tragic 30.9% |
| Ute | 0.1 /100 | #292 | Tragic 30.9% |
| Cape Verdeans | 0.1 /100 | #293 | Tragic 30.9% |
Demographics Similar to Iraqis by Bachelor's Degree
In terms of bachelor's degree, the demographic groups most similar to Iraqis are Immigrants from Poland (39.0%, a difference of 0.080%), South American (38.9%, a difference of 0.11%), Immigrants from Sierra Leone (39.0%, a difference of 0.14%), Swedish (39.1%, a difference of 0.17%), and Slovene (39.1%, a difference of 0.21%).
| Demographics | Rating | Rank | Bachelor's Degree |
| South American Indians | 83.6 /100 | #141 | Excellent 39.3% |
| Immigrants | North Macedonia | 81.6 /100 | #142 | Excellent 39.2% |
| Poles | 79.8 /100 | #143 | Good 39.1% |
| Immigrants | Afghanistan | 79.7 /100 | #144 | Good 39.1% |
| Slovenes | 79.5 /100 | #145 | Good 39.1% |
| Swedes | 79.2 /100 | #146 | Good 39.1% |
| Immigrants | Sierra Leone | 79.0 /100 | #147 | Good 39.0% |
| Iraqis | 78.1 /100 | #148 | Good 39.0% |
| Immigrants | Poland | 77.5 /100 | #149 | Good 39.0% |
| South Americans | 77.3 /100 | #150 | Good 38.9% |
| Immigrants | Africa | 76.5 /100 | #151 | Good 38.9% |
| Sudanese | 76.4 /100 | #152 | Good 38.9% |
| Slavs | 75.9 /100 | #153 | Good 38.9% |
| Canadians | 75.0 /100 | #154 | Good 38.8% |
| Immigrants | Kenya | 73.8 /100 | #155 | Good 38.8% |