Immigrants from Uganda vs Iraqi Poverty
COMPARE
Immigrants from Uganda
Iraqi
Poverty
Poverty Comparison
Immigrants from Uganda
Iraqis
12.8%
POVERTY
16.5/ 100
METRIC RATING
201st/ 347
METRIC RANK
12.7%
POVERTY
20.8/ 100
METRIC RATING
196th/ 347
METRIC RANK
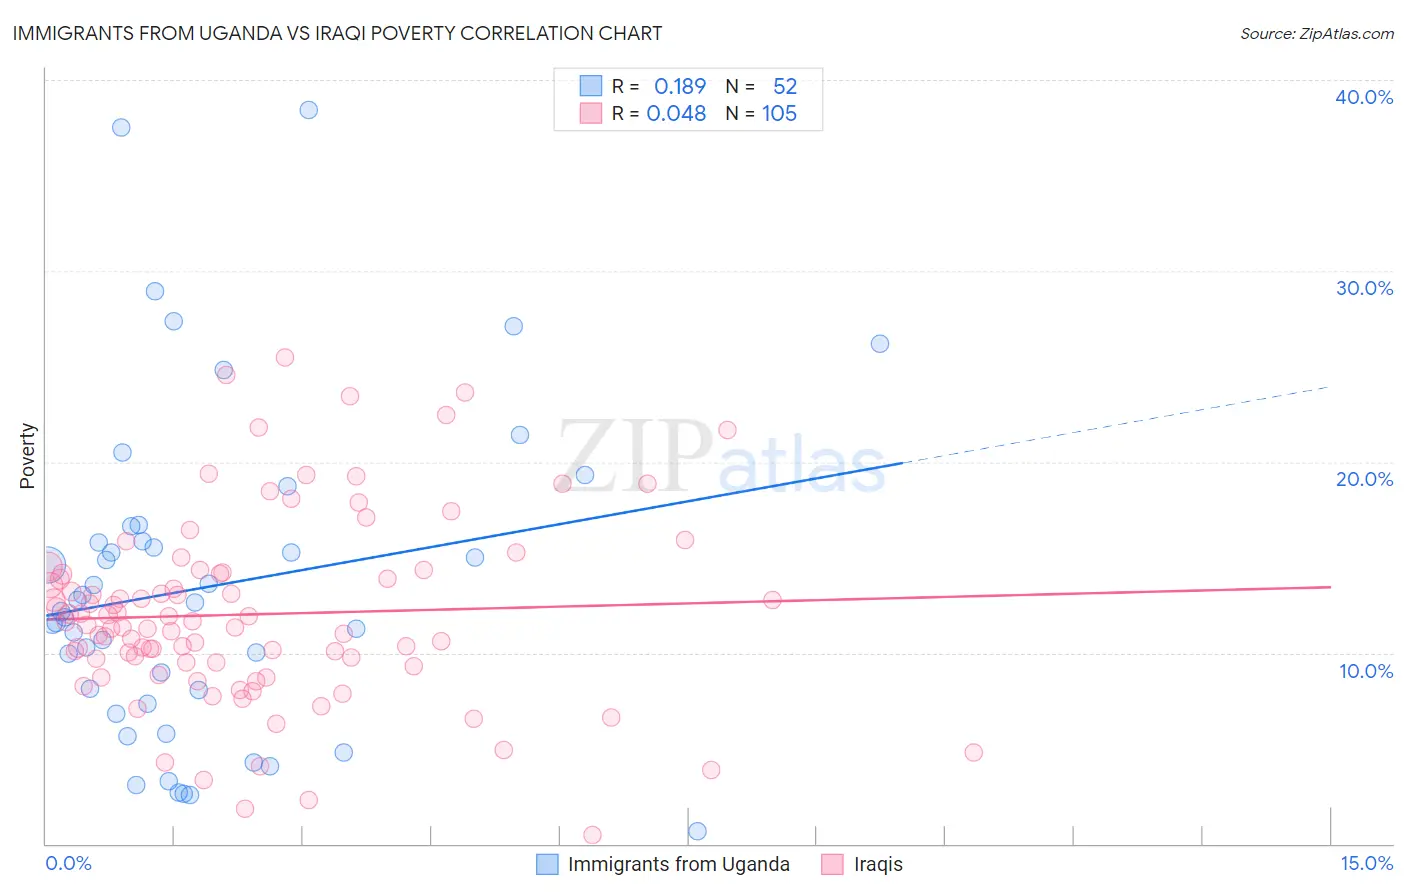
Immigrants from Uganda vs Iraqi Poverty Correlation Chart
The statistical analysis conducted on geographies consisting of 125,970,249 people shows a poor positive correlation between the proportion of Immigrants from Uganda and poverty level in the United States with a correlation coefficient (R) of 0.189 and weighted average of 12.8%. Similarly, the statistical analysis conducted on geographies consisting of 170,596,700 people shows no correlation between the proportion of Iraqis and poverty level in the United States with a correlation coefficient (R) of 0.048 and weighted average of 12.7%, a difference of 0.66%.
Poverty Correlation Summary
| Measurement | Immigrants from Uganda | Iraqi |
| Minimum | 0.63% | 0.47% |
| Maximum | 38.4% | 25.4% |
| Range | 37.8% | 25.0% |
| Mean | 13.5% | 12.0% |
| Median | 12.4% | 11.5% |
| Interquartile 25% (IQ1) | 7.7% | 9.4% |
| Interquartile 75% (IQ3) | 16.2% | 14.2% |
| Interquartile Range (IQR) | 8.6% | 4.8% |
| Standard Deviation (Sample) | 8.5% | 4.9% |
| Standard Deviation (Population) | 8.4% | 4.9% |
Demographics Similar to Immigrants from Uganda and Iraqis by Poverty
In terms of poverty, the demographic groups most similar to Immigrants from Uganda are Spaniard (12.8%, a difference of 0.0%), Immigrants from Kenya (12.8%, a difference of 0.16%), Immigrants from Uruguay (12.8%, a difference of 0.16%), Hmong (12.8%, a difference of 0.26%), and Immigrants from Lebanon (12.8%, a difference of 0.35%). Similarly, the demographic groups most similar to Iraqis are Immigrants from Kuwait (12.7%, a difference of 0.020%), Arab (12.7%, a difference of 0.050%), Delaware (12.7%, a difference of 0.090%), Immigrants from Lebanon (12.8%, a difference of 0.31%), and Spanish (12.8%, a difference of 0.31%).
| Demographics | Rating | Rank | Poverty |
| Immigrants | Costa Rica | 33.3 /100 | #188 | Fair 12.5% |
| Aleuts | 33.2 /100 | #189 | Fair 12.5% |
| Immigrants | South America | 32.3 /100 | #190 | Fair 12.5% |
| Sierra Leoneans | 31.5 /100 | #191 | Fair 12.6% |
| South American Indians | 23.3 /100 | #192 | Fair 12.7% |
| Delaware | 21.4 /100 | #193 | Fair 12.7% |
| Arabs | 21.1 /100 | #194 | Fair 12.7% |
| Immigrants | Kuwait | 20.9 /100 | #195 | Fair 12.7% |
| Iraqis | 20.8 /100 | #196 | Fair 12.7% |
| Immigrants | Lebanon | 18.7 /100 | #197 | Poor 12.8% |
| Spanish | 18.7 /100 | #198 | Poor 12.8% |
| Immigrants | Kenya | 17.5 /100 | #199 | Poor 12.8% |
| Spaniards | 16.5 /100 | #200 | Poor 12.8% |
| Immigrants | Uganda | 16.5 /100 | #201 | Poor 12.8% |
| Immigrants | Uruguay | 15.6 /100 | #202 | Poor 12.8% |
| Hmong | 15.0 /100 | #203 | Poor 12.8% |
| Immigrants | Western Asia | 14.1 /100 | #204 | Poor 12.9% |
| Tsimshian | 9.2 /100 | #205 | Tragic 13.0% |
| Immigrants | Eastern Africa | 7.0 /100 | #206 | Tragic 13.1% |
| Panamanians | 6.6 /100 | #207 | Tragic 13.1% |
| Ugandans | 6.2 /100 | #208 | Tragic 13.1% |