Immigrants from El Salvador vs Israeli Single Mother Poverty
COMPARE
Immigrants from El Salvador
Israeli
Single Mother Poverty
Single Mother Poverty Comparison
Immigrants from El Salvador
Israelis
31.2%
SINGLE MOTHER POVERTY
0.3/ 100
METRIC RATING
261st/ 347
METRIC RANK
28.0%
SINGLE MOTHER POVERTY
96.5/ 100
METRIC RATING
105th/ 347
METRIC RANK
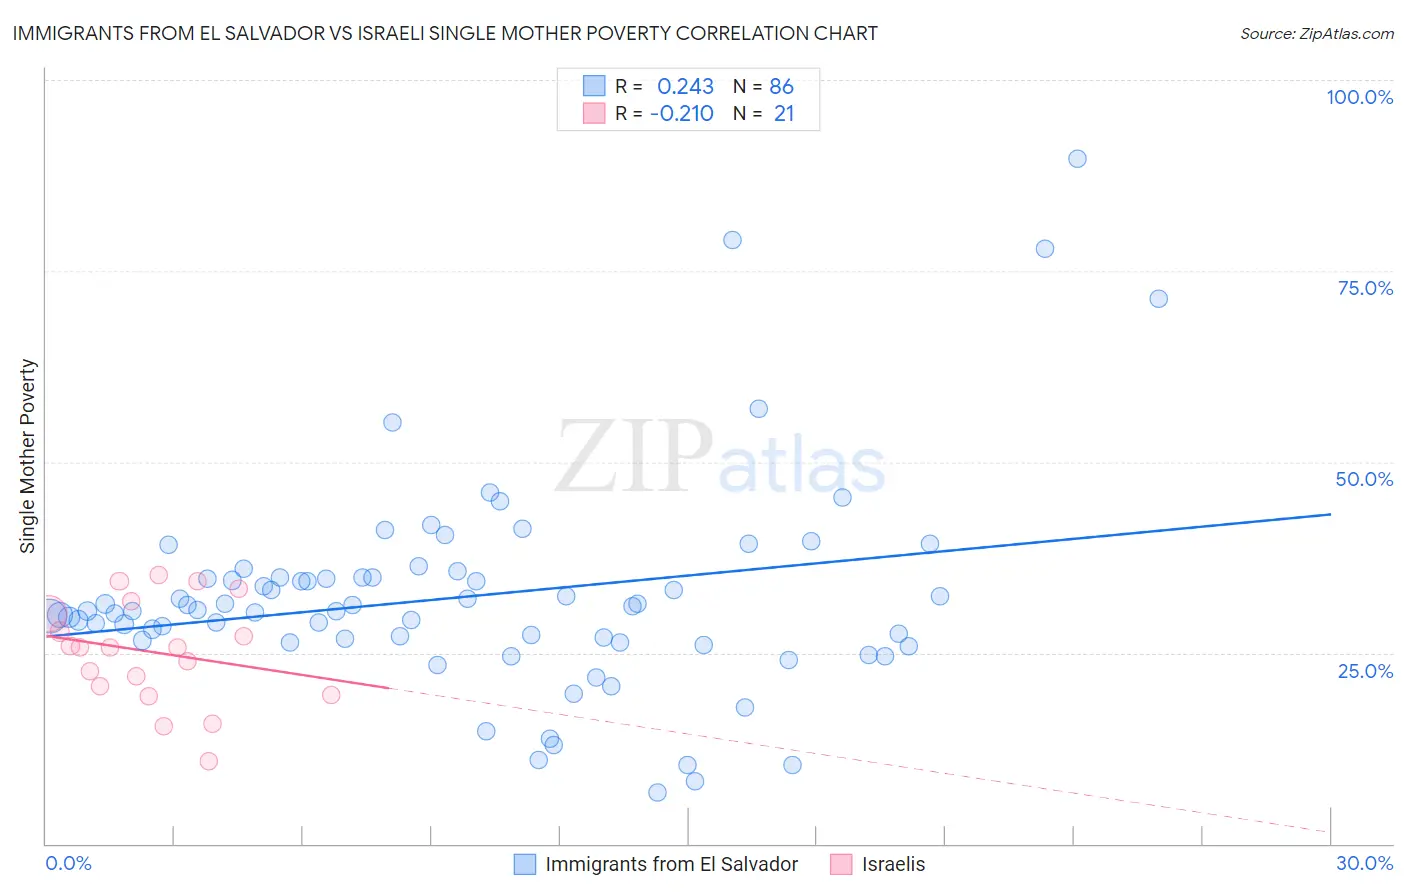
Immigrants from El Salvador vs Israeli Single Mother Poverty Correlation Chart
The statistical analysis conducted on geographies consisting of 352,610,814 people shows a weak positive correlation between the proportion of Immigrants from El Salvador and poverty level among single mothers in the United States with a correlation coefficient (R) of 0.243 and weighted average of 31.2%. Similarly, the statistical analysis conducted on geographies consisting of 207,028,427 people shows a weak negative correlation between the proportion of Israelis and poverty level among single mothers in the United States with a correlation coefficient (R) of -0.210 and weighted average of 28.0%, a difference of 11.4%.
Single Mother Poverty Correlation Summary
| Measurement | Immigrants from El Salvador | Israeli |
| Minimum | 6.7% | 10.8% |
| Maximum | 89.6% | 35.2% |
| Range | 83.0% | 24.4% |
| Mean | 32.4% | 25.1% |
| Median | 30.6% | 25.6% |
| Interquartile 25% (IQ1) | 26.6% | 20.1% |
| Interquartile 75% (IQ3) | 34.8% | 31.0% |
| Interquartile Range (IQR) | 8.2% | 10.9% |
| Standard Deviation (Sample) | 13.9% | 6.8% |
| Standard Deviation (Population) | 13.8% | 6.6% |
Similar Demographics by Single Mother Poverty
Demographics Similar to Immigrants from El Salvador by Single Mother Poverty
In terms of single mother poverty, the demographic groups most similar to Immigrants from El Salvador are White/Caucasian (31.2%, a difference of 0.080%), Hmong (31.2%, a difference of 0.14%), Immigrants from Bangladesh (31.1%, a difference of 0.23%), Immigrants from Caribbean (31.1%, a difference of 0.27%), and Immigrants from Bahamas (31.1%, a difference of 0.35%).
| Demographics | Rating | Rank | Single Mother Poverty |
| Senegalese | 0.5 /100 | #254 | Tragic 31.0% |
| Belizeans | 0.5 /100 | #255 | Tragic 31.0% |
| Immigrants | West Indies | 0.4 /100 | #256 | Tragic 31.1% |
| Immigrants | Bahamas | 0.4 /100 | #257 | Tragic 31.1% |
| Immigrants | Caribbean | 0.4 /100 | #258 | Tragic 31.1% |
| Immigrants | Bangladesh | 0.4 /100 | #259 | Tragic 31.1% |
| Whites/Caucasians | 0.3 /100 | #260 | Tragic 31.2% |
| Immigrants | El Salvador | 0.3 /100 | #261 | Tragic 31.2% |
| Hmong | 0.3 /100 | #262 | Tragic 31.2% |
| Bahamians | 0.2 /100 | #263 | Tragic 31.3% |
| Immigrants | Ecuador | 0.2 /100 | #264 | Tragic 31.3% |
| German Russians | 0.2 /100 | #265 | Tragic 31.3% |
| Sub-Saharan Africans | 0.2 /100 | #266 | Tragic 31.4% |
| Immigrants | Belize | 0.2 /100 | #267 | Tragic 31.4% |
| Immigrants | Senegal | 0.1 /100 | #268 | Tragic 31.5% |
Demographics Similar to Israelis by Single Mother Poverty
In terms of single mother poverty, the demographic groups most similar to Israelis are Italian (28.0%, a difference of 0.020%), Immigrants from Northern Africa (28.0%, a difference of 0.040%), Ukrainian (28.0%, a difference of 0.040%), Immigrants from Croatia (28.0%, a difference of 0.060%), and Pakistani (28.0%, a difference of 0.16%).
| Demographics | Rating | Rank | Single Mother Poverty |
| Immigrants | Nepal | 97.2 /100 | #98 | Exceptional 27.9% |
| Immigrants | Netherlands | 97.2 /100 | #99 | Exceptional 27.9% |
| Zimbabweans | 97.1 /100 | #100 | Exceptional 27.9% |
| Pakistanis | 96.9 /100 | #101 | Exceptional 28.0% |
| Immigrants | Croatia | 96.7 /100 | #102 | Exceptional 28.0% |
| Immigrants | Northern Africa | 96.6 /100 | #103 | Exceptional 28.0% |
| Italians | 96.6 /100 | #104 | Exceptional 28.0% |
| Israelis | 96.5 /100 | #105 | Exceptional 28.0% |
| Ukrainians | 96.4 /100 | #106 | Exceptional 28.0% |
| Immigrants | Venezuela | 95.8 /100 | #107 | Exceptional 28.1% |
| Immigrants | Zimbabwe | 95.5 /100 | #108 | Exceptional 28.1% |
| Immigrants | Armenia | 95.2 /100 | #109 | Exceptional 28.1% |
| Croatians | 94.8 /100 | #110 | Exceptional 28.2% |
| Venezuelans | 94.5 /100 | #111 | Exceptional 28.2% |
| Immigrants | Kazakhstan | 94.5 /100 | #112 | Exceptional 28.2% |