Immigrants from El Salvador vs Immigrants from Argentina Single Mother Poverty
COMPARE
Immigrants from El Salvador
Immigrants from Argentina
Single Mother Poverty
Single Mother Poverty Comparison
Immigrants from El Salvador
Immigrants from Argentina
31.2%
SINGLE MOTHER POVERTY
0.3/ 100
METRIC RATING
261st/ 347
METRIC RANK
27.1%
SINGLE MOTHER POVERTY
99.7/ 100
METRIC RATING
51st/ 347
METRIC RANK
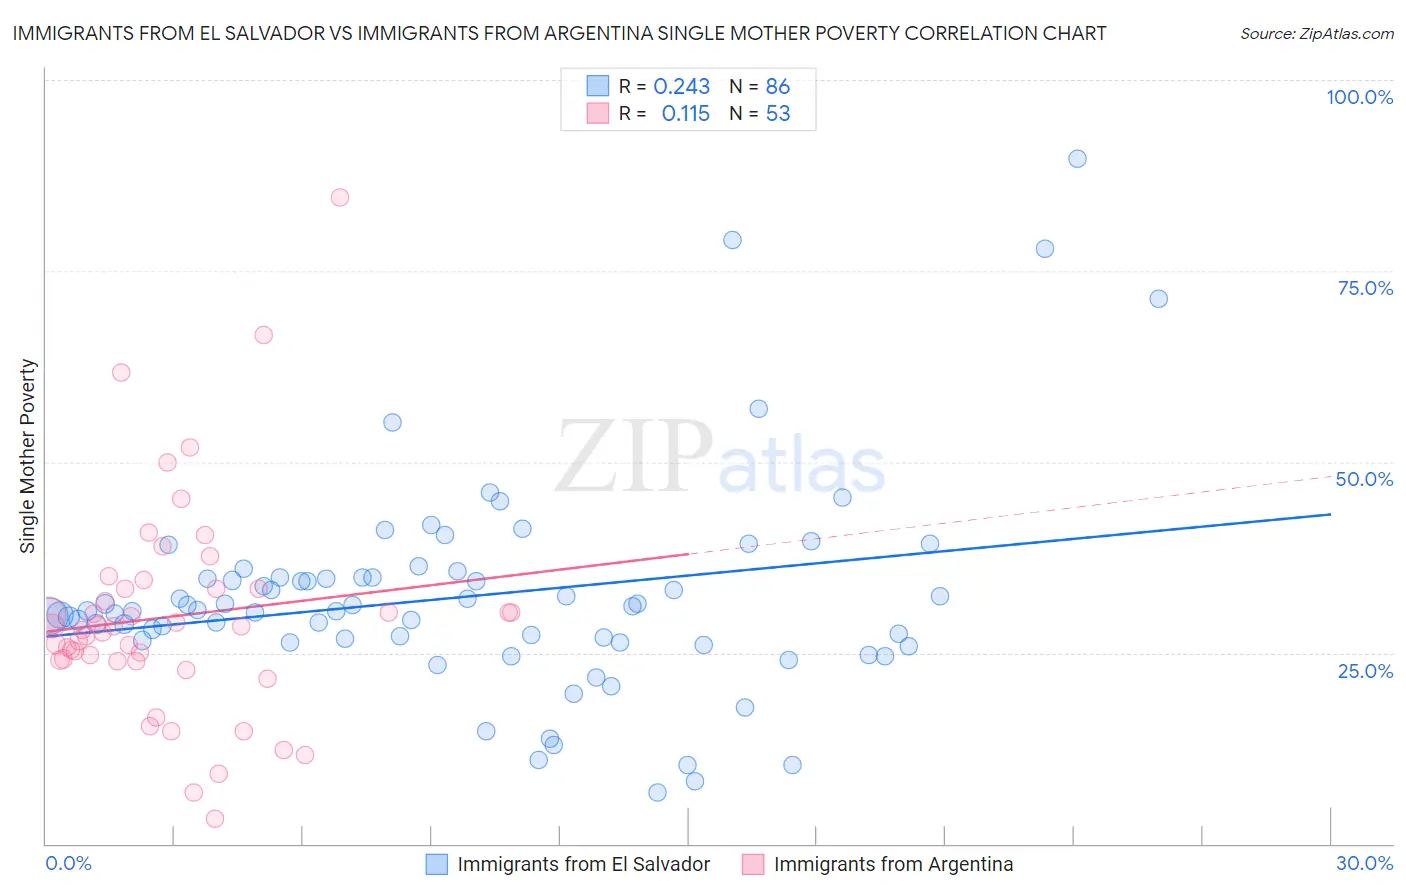
Immigrants from El Salvador vs Immigrants from Argentina Single Mother Poverty Correlation Chart
The statistical analysis conducted on geographies consisting of 352,610,814 people shows a weak positive correlation between the proportion of Immigrants from El Salvador and poverty level among single mothers in the United States with a correlation coefficient (R) of 0.243 and weighted average of 31.2%. Similarly, the statistical analysis conducted on geographies consisting of 259,658,600 people shows a poor positive correlation between the proportion of Immigrants from Argentina and poverty level among single mothers in the United States with a correlation coefficient (R) of 0.115 and weighted average of 27.1%, a difference of 15.1%.
Single Mother Poverty Correlation Summary
| Measurement | Immigrants from El Salvador | Immigrants from Argentina |
| Minimum | 6.7% | 3.3% |
| Maximum | 89.6% | 84.6% |
| Range | 83.0% | 81.3% |
| Mean | 32.4% | 29.7% |
| Median | 30.6% | 28.5% |
| Interquartile 25% (IQ1) | 26.6% | 24.0% |
| Interquartile 75% (IQ3) | 34.8% | 33.3% |
| Interquartile Range (IQR) | 8.2% | 9.3% |
| Standard Deviation (Sample) | 13.9% | 14.2% |
| Standard Deviation (Population) | 13.8% | 14.1% |
Similar Demographics by Single Mother Poverty
Demographics Similar to Immigrants from El Salvador by Single Mother Poverty
In terms of single mother poverty, the demographic groups most similar to Immigrants from El Salvador are White/Caucasian (31.2%, a difference of 0.080%), Hmong (31.2%, a difference of 0.14%), Immigrants from Bangladesh (31.1%, a difference of 0.23%), Immigrants from Caribbean (31.1%, a difference of 0.27%), and Immigrants from Bahamas (31.1%, a difference of 0.35%).
| Demographics | Rating | Rank | Single Mother Poverty |
| Senegalese | 0.5 /100 | #254 | Tragic 31.0% |
| Belizeans | 0.5 /100 | #255 | Tragic 31.0% |
| Immigrants | West Indies | 0.4 /100 | #256 | Tragic 31.1% |
| Immigrants | Bahamas | 0.4 /100 | #257 | Tragic 31.1% |
| Immigrants | Caribbean | 0.4 /100 | #258 | Tragic 31.1% |
| Immigrants | Bangladesh | 0.4 /100 | #259 | Tragic 31.1% |
| Whites/Caucasians | 0.3 /100 | #260 | Tragic 31.2% |
| Immigrants | El Salvador | 0.3 /100 | #261 | Tragic 31.2% |
| Hmong | 0.3 /100 | #262 | Tragic 31.2% |
| Bahamians | 0.2 /100 | #263 | Tragic 31.3% |
| Immigrants | Ecuador | 0.2 /100 | #264 | Tragic 31.3% |
| German Russians | 0.2 /100 | #265 | Tragic 31.3% |
| Sub-Saharan Africans | 0.2 /100 | #266 | Tragic 31.4% |
| Immigrants | Belize | 0.2 /100 | #267 | Tragic 31.4% |
| Immigrants | Senegal | 0.1 /100 | #268 | Tragic 31.5% |
Demographics Similar to Immigrants from Argentina by Single Mother Poverty
In terms of single mother poverty, the demographic groups most similar to Immigrants from Argentina are Immigrants from South Eastern Asia (27.1%, a difference of 0.040%), Immigrants from Jordan (27.1%, a difference of 0.080%), Immigrants from Bulgaria (27.1%, a difference of 0.11%), Immigrants from Egypt (27.1%, a difference of 0.14%), and Immigrants from Romania (27.2%, a difference of 0.19%).
| Demographics | Rating | Rank | Single Mother Poverty |
| Immigrants | Sierra Leone | 99.9 /100 | #44 | Exceptional 26.9% |
| Latvians | 99.9 /100 | #45 | Exceptional 26.9% |
| Immigrants | Serbia | 99.9 /100 | #46 | Exceptional 26.9% |
| Egyptians | 99.8 /100 | #47 | Exceptional 26.9% |
| Immigrants | Poland | 99.8 /100 | #48 | Exceptional 26.9% |
| Cambodians | 99.8 /100 | #49 | Exceptional 27.0% |
| Laotians | 99.8 /100 | #50 | Exceptional 27.0% |
| Immigrants | Argentina | 99.7 /100 | #51 | Exceptional 27.1% |
| Immigrants | South Eastern Asia | 99.7 /100 | #52 | Exceptional 27.1% |
| Immigrants | Jordan | 99.7 /100 | #53 | Exceptional 27.1% |
| Immigrants | Bulgaria | 99.7 /100 | #54 | Exceptional 27.1% |
| Immigrants | Egypt | 99.7 /100 | #55 | Exceptional 27.1% |
| Immigrants | Romania | 99.7 /100 | #56 | Exceptional 27.2% |
| Palestinians | 99.7 /100 | #57 | Exceptional 27.2% |
| Argentineans | 99.6 /100 | #58 | Exceptional 27.2% |