Immigrants from Egypt vs Comanche In Labor Force | Age 20-64
COMPARE
Immigrants from Egypt
Comanche
In Labor Force | Age 20-64
In Labor Force | Age 20-64 Comparison
Immigrants from Egypt
Comanche
80.1%
IN LABOR FORCE | AGE 20-64
97.1/ 100
METRIC RATING
86th/ 347
METRIC RANK
77.0%
IN LABOR FORCE | AGE 20-64
0.0/ 100
METRIC RATING
310th/ 347
METRIC RANK
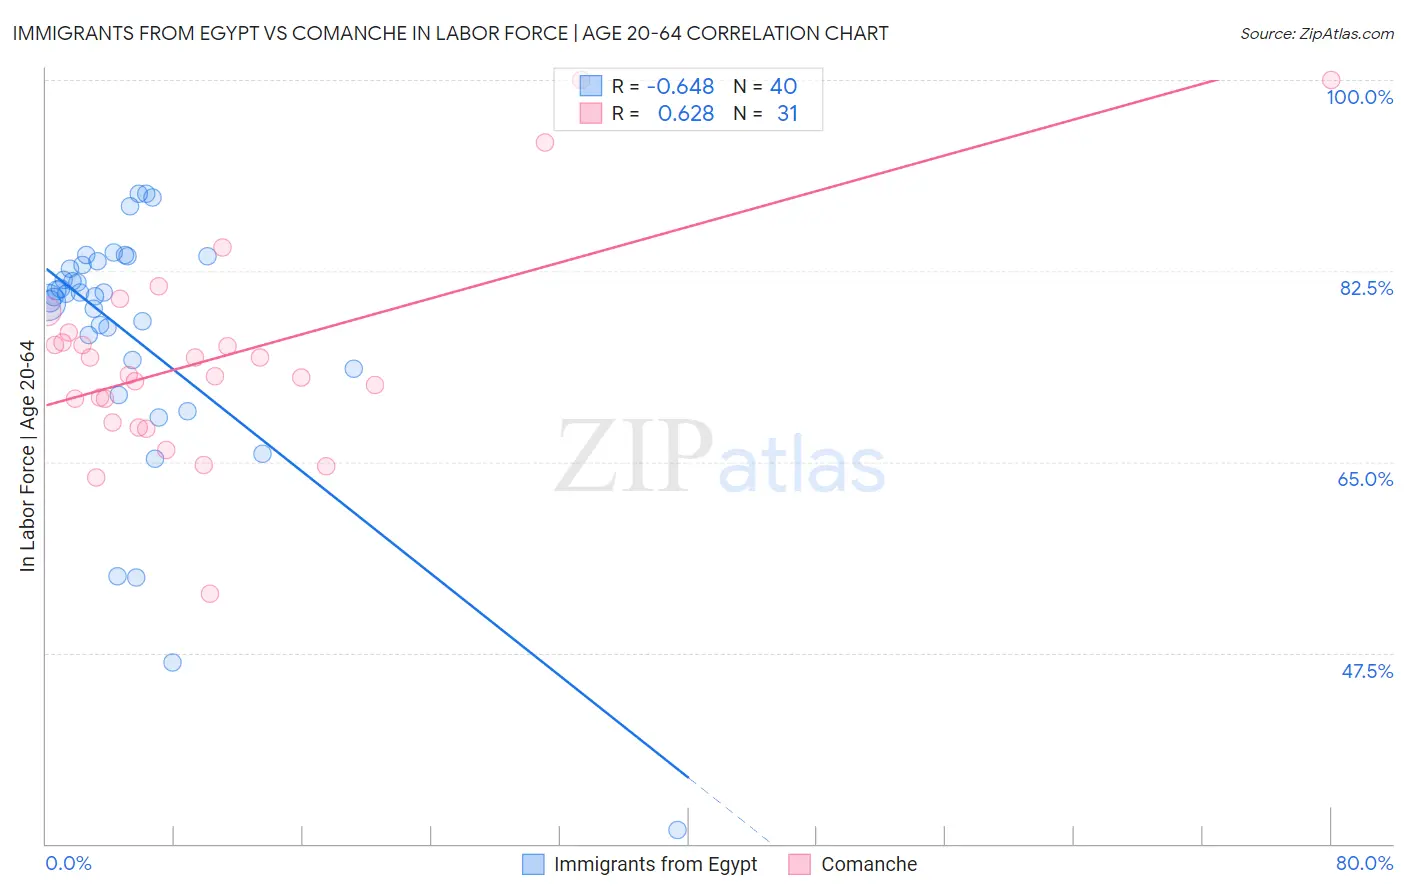
Immigrants from Egypt vs Comanche In Labor Force | Age 20-64 Correlation Chart
The statistical analysis conducted on geographies consisting of 245,492,161 people shows a significant negative correlation between the proportion of Immigrants from Egypt and labor force participation rate among population between the ages 20 and 64 in the United States with a correlation coefficient (R) of -0.648 and weighted average of 80.1%. Similarly, the statistical analysis conducted on geographies consisting of 109,783,732 people shows a significant positive correlation between the proportion of Comanche and labor force participation rate among population between the ages 20 and 64 in the United States with a correlation coefficient (R) of 0.628 and weighted average of 77.0%, a difference of 4.0%.
In Labor Force | Age 20-64 Correlation Summary
| Measurement | Immigrants from Egypt | Comanche |
| Minimum | 31.3% | 52.9% |
| Maximum | 89.6% | 100.0% |
| Range | 58.3% | 47.1% |
| Mean | 76.4% | 74.7% |
| Median | 80.3% | 73.0% |
| Interquartile 25% (IQ1) | 73.9% | 68.6% |
| Interquartile 75% (IQ3) | 83.2% | 76.8% |
| Interquartile Range (IQR) | 9.3% | 8.3% |
| Standard Deviation (Sample) | 11.9% | 9.9% |
| Standard Deviation (Population) | 11.8% | 9.7% |
Similar Demographics by In Labor Force | Age 20-64
Demographics Similar to Immigrants from Egypt by In Labor Force | Age 20-64
In terms of in labor force | age 20-64, the demographic groups most similar to Immigrants from Egypt are Jordanian (80.1%, a difference of 0.0%), Croatian (80.1%, a difference of 0.0%), German Russian (80.1%, a difference of 0.010%), Immigrants from Japan (80.1%, a difference of 0.010%), and Colombian (80.1%, a difference of 0.010%).
| Demographics | Rating | Rank | In Labor Force | Age 20-64 |
| Asians | 97.7 /100 | #79 | Exceptional 80.2% |
| Immigrants | Croatia | 97.6 /100 | #80 | Exceptional 80.1% |
| German Russians | 97.3 /100 | #81 | Exceptional 80.1% |
| Immigrants | Japan | 97.3 /100 | #82 | Exceptional 80.1% |
| Colombians | 97.3 /100 | #83 | Exceptional 80.1% |
| Immigrants | Latvia | 97.2 /100 | #84 | Exceptional 80.1% |
| Jordanians | 97.2 /100 | #85 | Exceptional 80.1% |
| Immigrants | Egypt | 97.1 /100 | #86 | Exceptional 80.1% |
| Croatians | 97.1 /100 | #87 | Exceptional 80.1% |
| Chileans | 97.0 /100 | #88 | Exceptional 80.1% |
| Immigrants | Venezuela | 96.8 /100 | #89 | Exceptional 80.1% |
| Poles | 96.8 /100 | #90 | Exceptional 80.1% |
| Uruguayans | 96.7 /100 | #91 | Exceptional 80.1% |
| Ghanaians | 96.7 /100 | #92 | Exceptional 80.1% |
| Immigrants | Belarus | 96.4 /100 | #93 | Exceptional 80.1% |
Demographics Similar to Comanche by In Labor Force | Age 20-64
In terms of in labor force | age 20-64, the demographic groups most similar to Comanche are Alaska Native (77.0%, a difference of 0.020%), American (77.0%, a difference of 0.020%), Blackfeet (77.0%, a difference of 0.030%), Central American Indian (77.1%, a difference of 0.080%), and Alaskan Athabascan (76.9%, a difference of 0.21%).
| Demographics | Rating | Rank | In Labor Force | Age 20-64 |
| Chippewa | 0.0 /100 | #303 | Tragic 77.3% |
| Immigrants | Mexico | 0.0 /100 | #304 | Tragic 77.3% |
| Mexicans | 0.0 /100 | #305 | Tragic 77.2% |
| Potawatomi | 0.0 /100 | #306 | Tragic 77.2% |
| Central American Indians | 0.0 /100 | #307 | Tragic 77.1% |
| Alaska Natives | 0.0 /100 | #308 | Tragic 77.0% |
| Americans | 0.0 /100 | #309 | Tragic 77.0% |
| Comanche | 0.0 /100 | #310 | Tragic 77.0% |
| Blackfeet | 0.0 /100 | #311 | Tragic 77.0% |
| Alaskan Athabascans | 0.0 /100 | #312 | Tragic 76.9% |
| Shoshone | 0.0 /100 | #313 | Tragic 76.8% |
| Blacks/African Americans | 0.0 /100 | #314 | Tragic 76.8% |
| Ottawa | 0.0 /100 | #315 | Tragic 76.7% |
| Yaqui | 0.0 /100 | #316 | Tragic 76.5% |
| Cherokee | 0.0 /100 | #317 | Tragic 76.2% |