Immigrants from Eastern Asia vs Icelander Female Poverty
COMPARE
Immigrants from Eastern Asia
Icelander
Female Poverty
Female Poverty Comparison
Immigrants from Eastern Asia
Icelanders
12.2%
FEMALE POVERTY
97.8/ 100
METRIC RATING
67th/ 347
METRIC RANK
13.0%
FEMALE POVERTY
81.1/ 100
METRIC RATING
141st/ 347
METRIC RANK
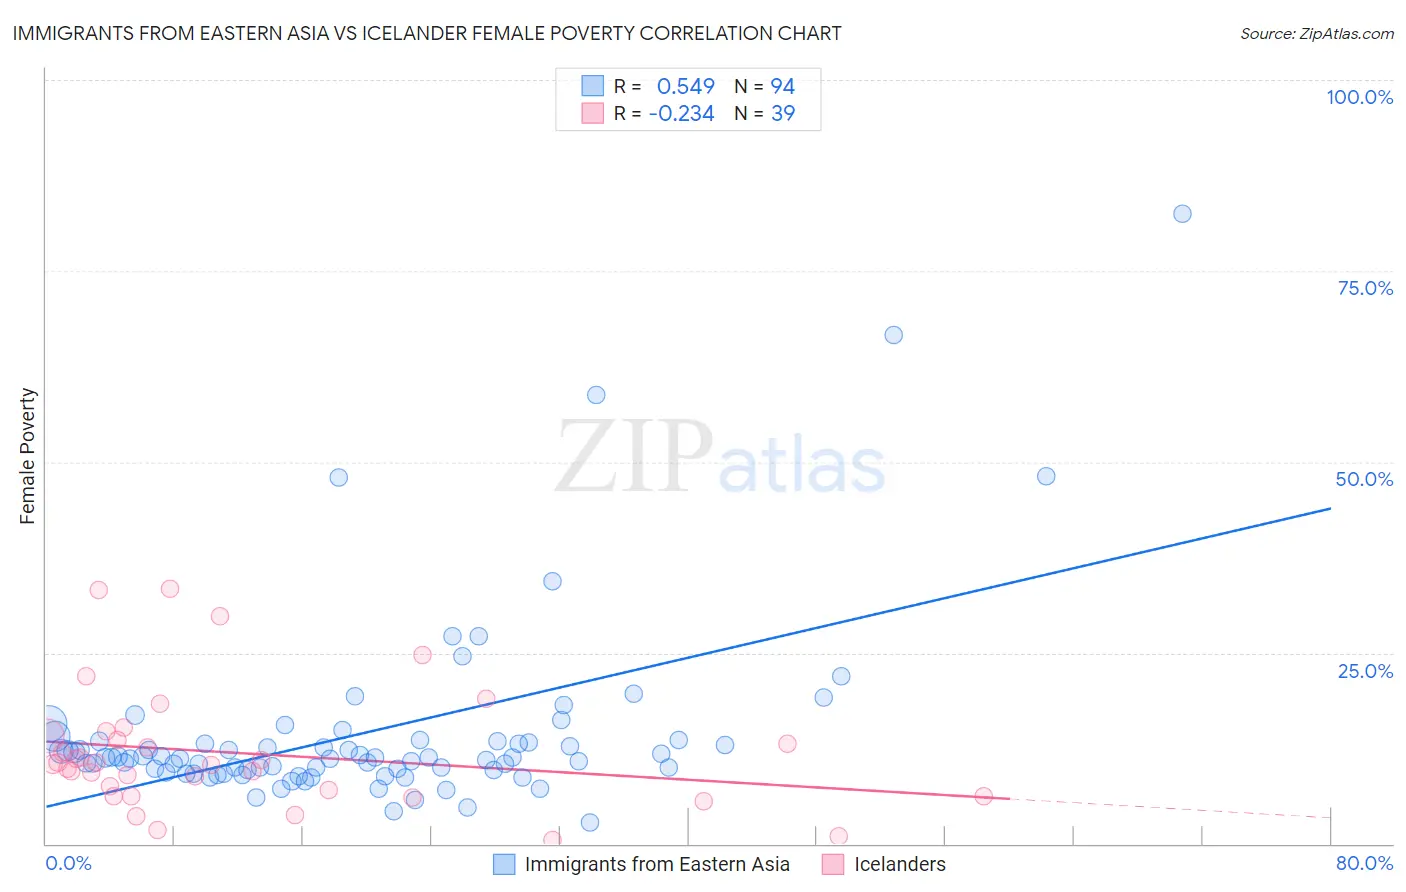
Immigrants from Eastern Asia vs Icelander Female Poverty Correlation Chart
The statistical analysis conducted on geographies consisting of 499,182,216 people shows a substantial positive correlation between the proportion of Immigrants from Eastern Asia and poverty level among females in the United States with a correlation coefficient (R) of 0.549 and weighted average of 12.2%. Similarly, the statistical analysis conducted on geographies consisting of 159,608,280 people shows a weak negative correlation between the proportion of Icelanders and poverty level among females in the United States with a correlation coefficient (R) of -0.234 and weighted average of 13.0%, a difference of 6.2%.
Female Poverty Correlation Summary
| Measurement | Immigrants from Eastern Asia | Icelander |
| Minimum | 2.9% | 0.47% |
| Maximum | 82.5% | 33.3% |
| Range | 79.7% | 32.9% |
| Mean | 14.5% | 11.8% |
| Median | 11.3% | 10.4% |
| Interquartile 25% (IQ1) | 9.7% | 6.2% |
| Interquartile 75% (IQ3) | 13.5% | 14.1% |
| Interquartile Range (IQR) | 3.8% | 7.8% |
| Standard Deviation (Sample) | 12.4% | 7.9% |
| Standard Deviation (Population) | 12.3% | 7.8% |
Similar Demographics by Female Poverty
Demographics Similar to Immigrants from Eastern Asia by Female Poverty
In terms of female poverty, the demographic groups most similar to Immigrants from Eastern Asia are Immigrants from Netherlands (12.2%, a difference of 0.040%), Austrian (12.2%, a difference of 0.13%), Indian (Asian) (12.2%, a difference of 0.14%), Swiss (12.2%, a difference of 0.14%), and German (12.2%, a difference of 0.17%).
| Demographics | Rating | Rank | Female Poverty |
| Immigrants | Australia | 98.1 /100 | #60 | Exceptional 12.2% |
| Immigrants | Asia | 98.1 /100 | #61 | Exceptional 12.2% |
| Immigrants | Italy | 98.0 /100 | #62 | Exceptional 12.2% |
| Ukrainians | 98.0 /100 | #63 | Exceptional 12.2% |
| Germans | 98.0 /100 | #64 | Exceptional 12.2% |
| Indians (Asian) | 97.9 /100 | #65 | Exceptional 12.2% |
| Austrians | 97.9 /100 | #66 | Exceptional 12.2% |
| Immigrants | Eastern Asia | 97.8 /100 | #67 | Exceptional 12.2% |
| Immigrants | Netherlands | 97.8 /100 | #68 | Exceptional 12.2% |
| Swiss | 97.7 /100 | #69 | Exceptional 12.2% |
| Immigrants | Belgium | 97.7 /100 | #70 | Exceptional 12.2% |
| Carpatho Rusyns | 97.6 /100 | #71 | Exceptional 12.2% |
| Cambodians | 97.5 /100 | #72 | Exceptional 12.2% |
| Zimbabweans | 97.5 /100 | #73 | Exceptional 12.3% |
| Immigrants | Canada | 97.5 /100 | #74 | Exceptional 12.3% |
Demographics Similar to Icelanders by Female Poverty
In terms of female poverty, the demographic groups most similar to Icelanders are Brazilian (13.0%, a difference of 0.10%), Immigrants from Malaysia (13.0%, a difference of 0.12%), Afghan (13.0%, a difference of 0.21%), Syrian (13.0%, a difference of 0.24%), and Immigrants from Peru (13.0%, a difference of 0.31%).
| Demographics | Rating | Rank | Female Poverty |
| Immigrants | Switzerland | 85.8 /100 | #134 | Excellent 12.9% |
| French | 85.6 /100 | #135 | Excellent 12.9% |
| Peruvians | 85.2 /100 | #136 | Excellent 12.9% |
| Chileans | 84.7 /100 | #137 | Excellent 12.9% |
| Immigrants | France | 83.6 /100 | #138 | Excellent 12.9% |
| Basques | 83.1 /100 | #139 | Excellent 12.9% |
| Pakistanis | 83.0 /100 | #140 | Excellent 12.9% |
| Icelanders | 81.1 /100 | #141 | Excellent 13.0% |
| Brazilians | 80.5 /100 | #142 | Excellent 13.0% |
| Immigrants | Malaysia | 80.4 /100 | #143 | Excellent 13.0% |
| Afghans | 79.8 /100 | #144 | Good 13.0% |
| Syrians | 79.6 /100 | #145 | Good 13.0% |
| Immigrants | Peru | 79.1 /100 | #146 | Good 13.0% |
| Immigrants | Kazakhstan | 78.6 /100 | #147 | Good 13.0% |
| Yugoslavians | 76.9 /100 | #148 | Good 13.1% |