Immigrants from Eastern Asia vs Okinawan Female Poverty
COMPARE
Immigrants from Eastern Asia
Okinawan
Female Poverty
Female Poverty Comparison
Immigrants from Eastern Asia
Okinawans
12.2%
FEMALE POVERTY
97.8/ 100
METRIC RATING
67th/ 347
METRIC RANK
12.4%
FEMALE POVERTY
96.4/ 100
METRIC RATING
87th/ 347
METRIC RANK
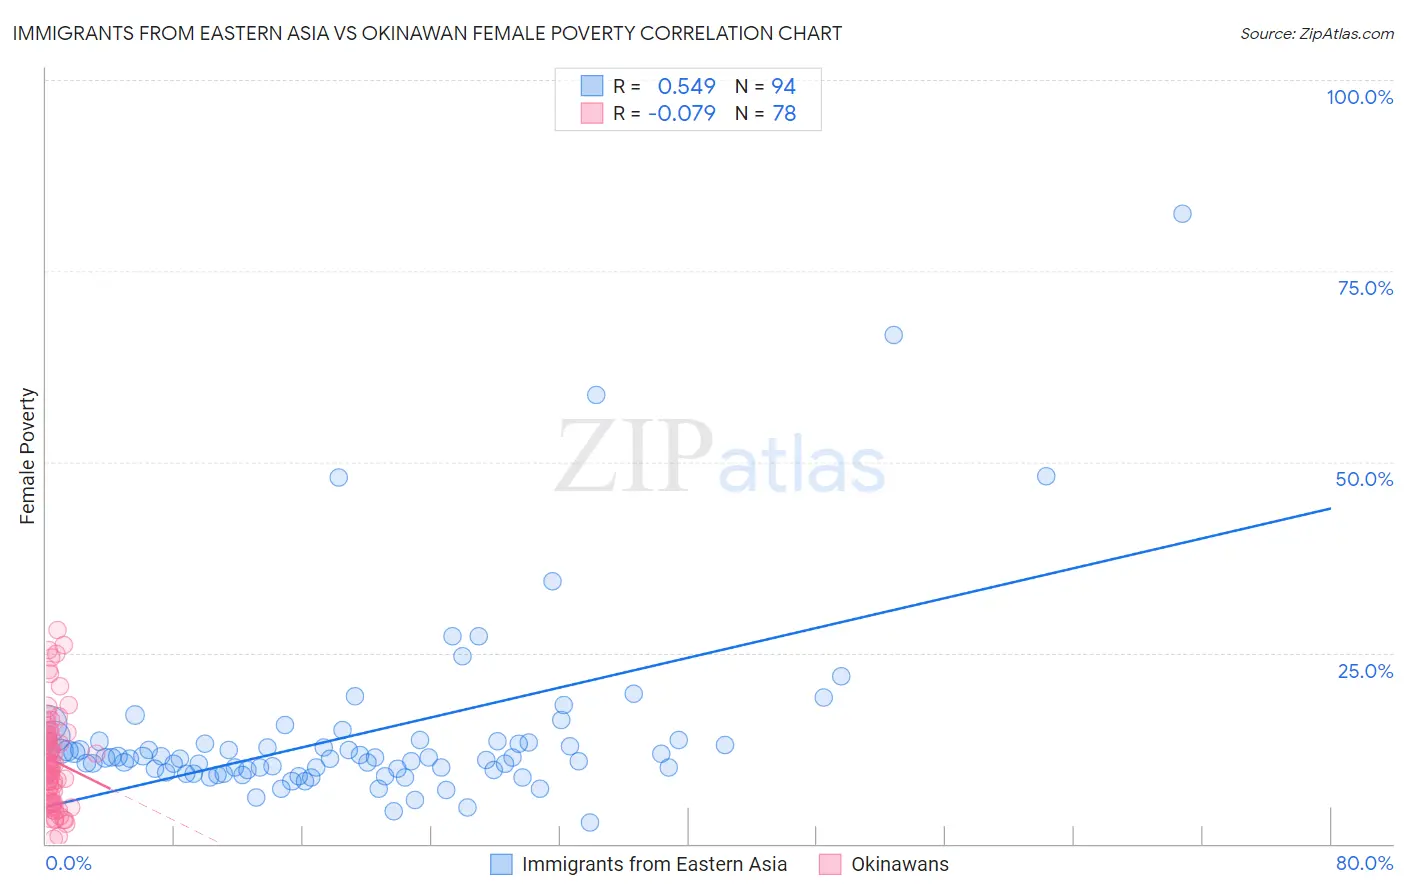
Immigrants from Eastern Asia vs Okinawan Female Poverty Correlation Chart
The statistical analysis conducted on geographies consisting of 499,182,216 people shows a substantial positive correlation between the proportion of Immigrants from Eastern Asia and poverty level among females in the United States with a correlation coefficient (R) of 0.549 and weighted average of 12.2%. Similarly, the statistical analysis conducted on geographies consisting of 73,724,084 people shows a slight negative correlation between the proportion of Okinawans and poverty level among females in the United States with a correlation coefficient (R) of -0.079 and weighted average of 12.4%, a difference of 1.3%.
Female Poverty Correlation Summary
| Measurement | Immigrants from Eastern Asia | Okinawan |
| Minimum | 2.9% | 0.59% |
| Maximum | 82.5% | 28.0% |
| Range | 79.7% | 27.4% |
| Mean | 14.5% | 10.9% |
| Median | 11.3% | 10.1% |
| Interquartile 25% (IQ1) | 9.7% | 5.5% |
| Interquartile 75% (IQ3) | 13.5% | 14.2% |
| Interquartile Range (IQR) | 3.8% | 8.7% |
| Standard Deviation (Sample) | 12.4% | 6.3% |
| Standard Deviation (Population) | 12.3% | 6.2% |
Demographics Similar to Immigrants from Eastern Asia and Okinawans by Female Poverty
In terms of female poverty, the demographic groups most similar to Immigrants from Eastern Asia are Immigrants from Netherlands (12.2%, a difference of 0.040%), Swiss (12.2%, a difference of 0.14%), Immigrants from Belgium (12.2%, a difference of 0.17%), Carpatho Rusyn (12.2%, a difference of 0.30%), and Cambodian (12.2%, a difference of 0.33%). Similarly, the demographic groups most similar to Okinawans are Dutch (12.4%, a difference of 0.020%), Irish (12.4%, a difference of 0.050%), Northern European (12.4%, a difference of 0.10%), Immigrants from England (12.3%, a difference of 0.33%), and Immigrants from Sweden (12.3%, a difference of 0.52%).
| Demographics | Rating | Rank | Female Poverty |
| Immigrants | Eastern Asia | 97.8 /100 | #67 | Exceptional 12.2% |
| Immigrants | Netherlands | 97.8 /100 | #68 | Exceptional 12.2% |
| Swiss | 97.7 /100 | #69 | Exceptional 12.2% |
| Immigrants | Belgium | 97.7 /100 | #70 | Exceptional 12.2% |
| Carpatho Rusyns | 97.6 /100 | #71 | Exceptional 12.2% |
| Cambodians | 97.5 /100 | #72 | Exceptional 12.2% |
| Zimbabweans | 97.5 /100 | #73 | Exceptional 12.3% |
| Immigrants | Canada | 97.5 /100 | #74 | Exceptional 12.3% |
| Europeans | 97.4 /100 | #75 | Exceptional 12.3% |
| Immigrants | Eastern Europe | 97.2 /100 | #76 | Exceptional 12.3% |
| Serbians | 97.2 /100 | #77 | Exceptional 12.3% |
| Egyptians | 97.2 /100 | #78 | Exceptional 12.3% |
| Immigrants | North America | 97.1 /100 | #79 | Exceptional 12.3% |
| Slovaks | 97.1 /100 | #80 | Exceptional 12.3% |
| Immigrants | Sweden | 97.1 /100 | #81 | Exceptional 12.3% |
| Jordanians | 97.1 /100 | #82 | Exceptional 12.3% |
| Immigrants | England | 96.9 /100 | #83 | Exceptional 12.3% |
| Northern Europeans | 96.6 /100 | #84 | Exceptional 12.4% |
| Irish | 96.5 /100 | #85 | Exceptional 12.4% |
| Dutch | 96.5 /100 | #86 | Exceptional 12.4% |
| Okinawans | 96.4 /100 | #87 | Exceptional 12.4% |