Immigrants from Dominica vs Immigrants from Argentina Single Male Poverty
COMPARE
Immigrants from Dominica
Immigrants from Argentina
Single Male Poverty
Single Male Poverty Comparison
Immigrants from Dominica
Immigrants from Argentina
14.5%
SINGLE MALE POVERTY
0.0/ 100
METRIC RATING
289th/ 347
METRIC RANK
11.9%
SINGLE MALE POVERTY
99.5/ 100
METRIC RATING
72nd/ 347
METRIC RANK
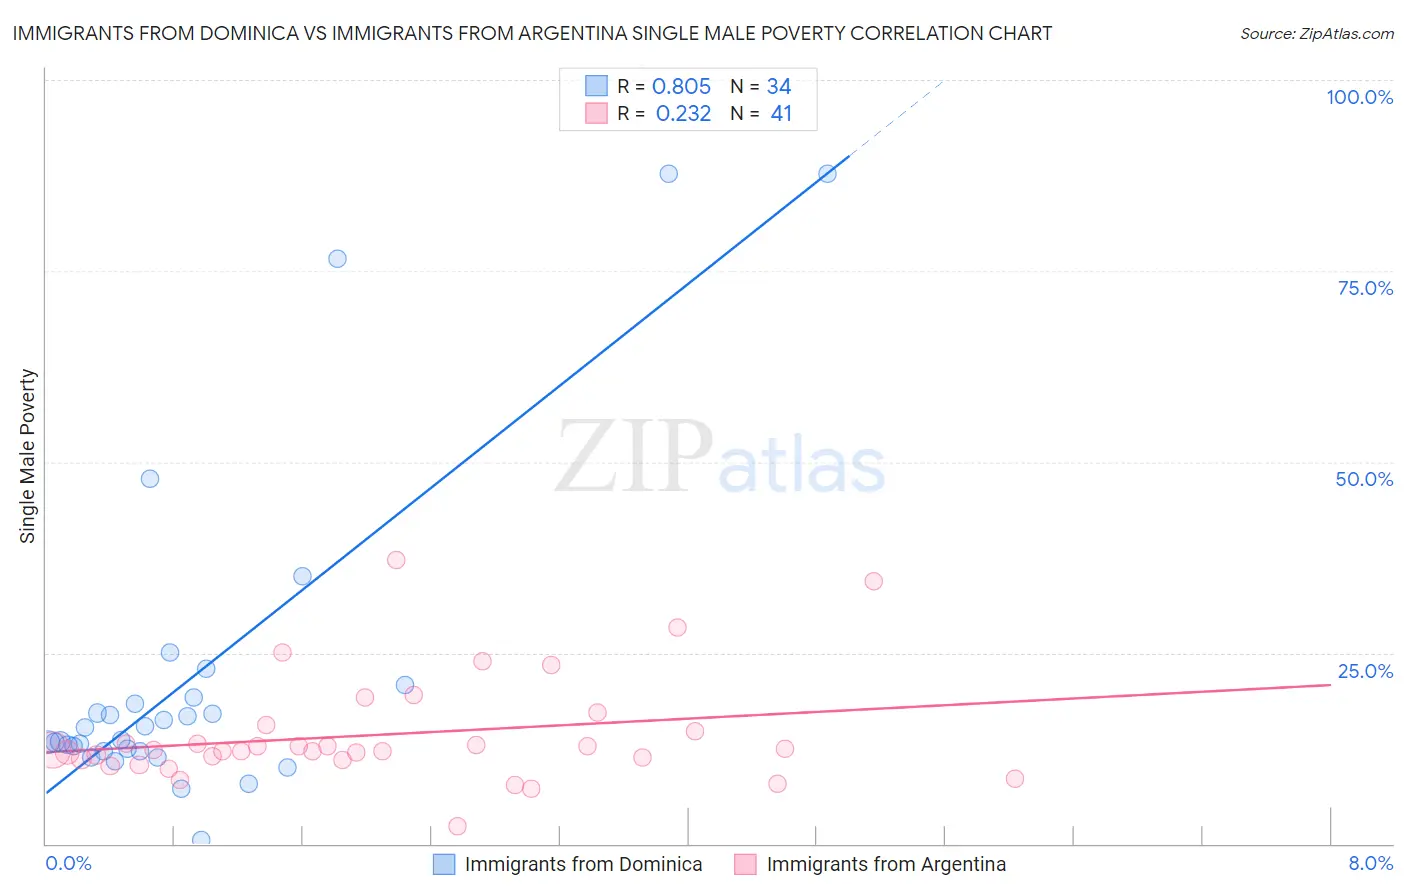
Immigrants from Dominica vs Immigrants from Argentina Single Male Poverty Correlation Chart
The statistical analysis conducted on geographies consisting of 81,406,108 people shows a very strong positive correlation between the proportion of Immigrants from Dominica and poverty level among single males in the United States with a correlation coefficient (R) of 0.805 and weighted average of 14.5%. Similarly, the statistical analysis conducted on geographies consisting of 240,377,704 people shows a weak positive correlation between the proportion of Immigrants from Argentina and poverty level among single males in the United States with a correlation coefficient (R) of 0.232 and weighted average of 11.9%, a difference of 21.9%.
Single Male Poverty Correlation Summary
| Measurement | Immigrants from Dominica | Immigrants from Argentina |
| Minimum | 0.56% | 2.3% |
| Maximum | 87.7% | 37.2% |
| Range | 87.1% | 35.0% |
| Mean | 21.9% | 14.3% |
| Median | 14.4% | 12.3% |
| Interquartile 25% (IQ1) | 12.1% | 11.0% |
| Interquartile 75% (IQ3) | 19.1% | 15.2% |
| Interquartile Range (IQR) | 7.0% | 4.1% |
| Standard Deviation (Sample) | 21.3% | 7.0% |
| Standard Deviation (Population) | 20.9% | 7.0% |
Similar Demographics by Single Male Poverty
Demographics Similar to Immigrants from Dominica by Single Male Poverty
In terms of single male poverty, the demographic groups most similar to Immigrants from Dominica are Iroquois (14.5%, a difference of 0.090%), White/Caucasian (14.5%, a difference of 0.090%), Celtic (14.5%, a difference of 0.22%), U.S. Virgin Islander (14.5%, a difference of 0.23%), and Bahamian (14.6%, a difference of 0.38%).
| Demographics | Rating | Rank | Single Male Poverty |
| Spanish Americans | 0.0 /100 | #282 | Tragic 14.2% |
| Yaqui | 0.0 /100 | #283 | Tragic 14.2% |
| Immigrants | Bahamas | 0.0 /100 | #284 | Tragic 14.4% |
| French | 0.0 /100 | #285 | Tragic 14.4% |
| Celtics | 0.0 /100 | #286 | Tragic 14.5% |
| Iroquois | 0.0 /100 | #287 | Tragic 14.5% |
| Whites/Caucasians | 0.0 /100 | #288 | Tragic 14.5% |
| Immigrants | Dominica | 0.0 /100 | #289 | Tragic 14.5% |
| U.S. Virgin Islanders | 0.0 /100 | #290 | Tragic 14.5% |
| Bahamians | 0.0 /100 | #291 | Tragic 14.6% |
| Immigrants | Nonimmigrants | 0.0 /100 | #292 | Tragic 14.6% |
| French Canadians | 0.0 /100 | #293 | Tragic 14.6% |
| Ottawa | 0.0 /100 | #294 | Tragic 14.6% |
| Scotch-Irish | 0.0 /100 | #295 | Tragic 14.7% |
| Africans | 0.0 /100 | #296 | Tragic 14.7% |
Demographics Similar to Immigrants from Argentina by Single Male Poverty
In terms of single male poverty, the demographic groups most similar to Immigrants from Argentina are Argentinean (11.9%, a difference of 0.13%), Immigrants from Greece (11.9%, a difference of 0.18%), Chilean (11.9%, a difference of 0.18%), Immigrants from Nepal (11.9%, a difference of 0.24%), and Immigrants from Russia (11.9%, a difference of 0.26%).
| Demographics | Rating | Rank | Single Male Poverty |
| Laotians | 99.6 /100 | #65 | Exceptional 11.9% |
| Immigrants | Uruguay | 99.6 /100 | #66 | Exceptional 11.9% |
| Immigrants | Ukraine | 99.6 /100 | #67 | Exceptional 11.9% |
| Immigrants | Croatia | 99.6 /100 | #68 | Exceptional 11.9% |
| Immigrants | Russia | 99.6 /100 | #69 | Exceptional 11.9% |
| Immigrants | Nepal | 99.6 /100 | #70 | Exceptional 11.9% |
| Immigrants | Greece | 99.6 /100 | #71 | Exceptional 11.9% |
| Immigrants | Argentina | 99.5 /100 | #72 | Exceptional 11.9% |
| Argentineans | 99.5 /100 | #73 | Exceptional 11.9% |
| Chileans | 99.5 /100 | #74 | Exceptional 11.9% |
| Uruguayans | 99.4 /100 | #75 | Exceptional 11.9% |
| Immigrants | Northern Africa | 99.4 /100 | #76 | Exceptional 11.9% |
| Immigrants | Malaysia | 99.2 /100 | #77 | Exceptional 12.0% |
| Immigrants | Venezuela | 99.1 /100 | #78 | Exceptional 12.0% |
| Immigrants | Belgium | 99.0 /100 | #79 | Exceptional 12.0% |