Immigrants from Denmark vs Immigrants from Somalia Poverty
COMPARE
Immigrants from Denmark
Immigrants from Somalia
Poverty
Poverty Comparison
Immigrants from Denmark
Immigrants from Somalia
11.4%
POVERTY
95.5/ 100
METRIC RATING
90th/ 347
METRIC RANK
15.8%
POVERTY
0.0/ 100
METRIC RATING
314th/ 347
METRIC RANK
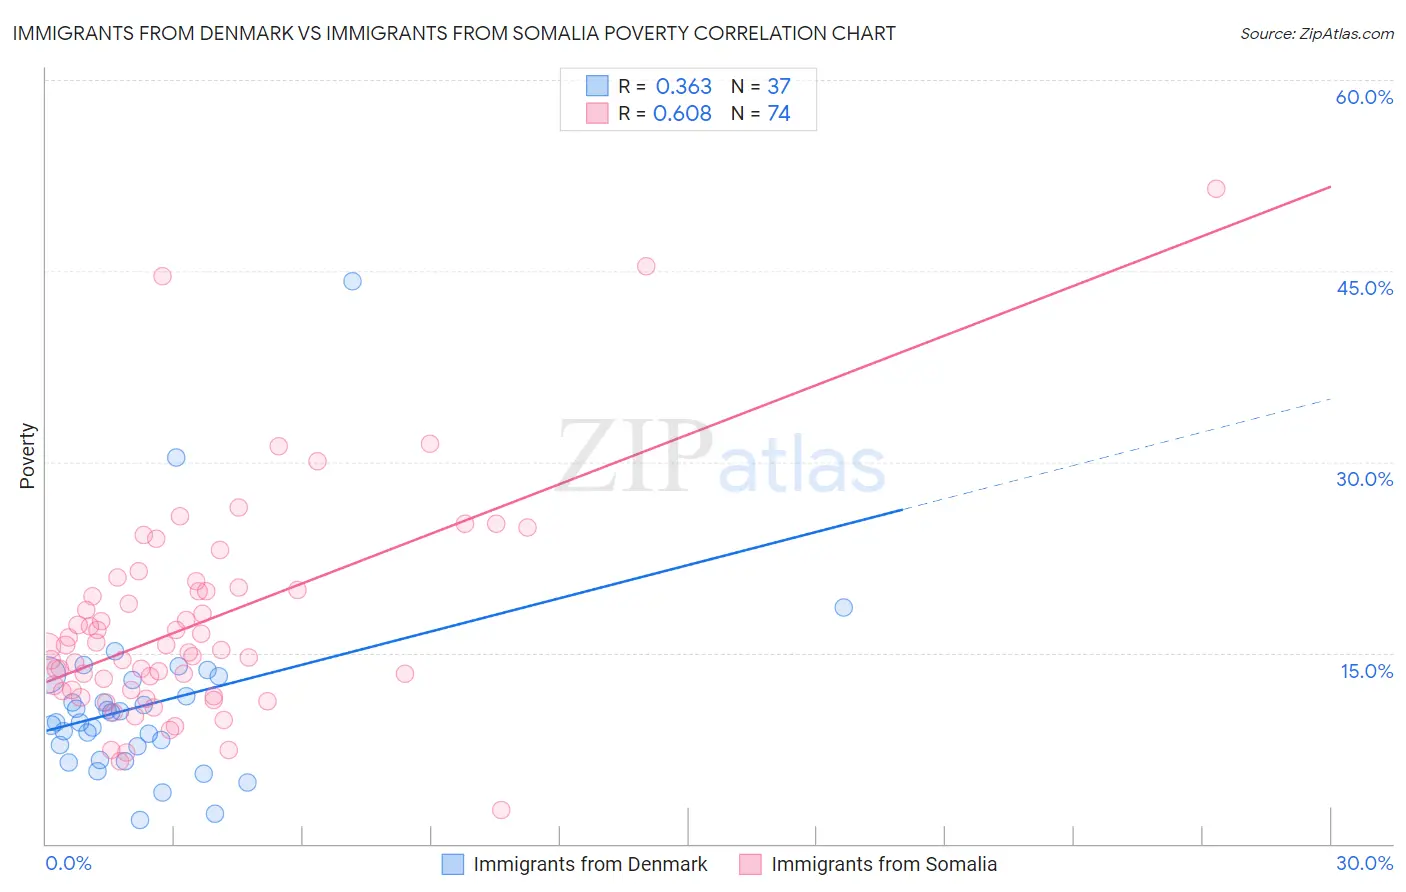
Immigrants from Denmark vs Immigrants from Somalia Poverty Correlation Chart
The statistical analysis conducted on geographies consisting of 136,404,120 people shows a mild positive correlation between the proportion of Immigrants from Denmark and poverty level in the United States with a correlation coefficient (R) of 0.363 and weighted average of 11.4%. Similarly, the statistical analysis conducted on geographies consisting of 92,107,608 people shows a significant positive correlation between the proportion of Immigrants from Somalia and poverty level in the United States with a correlation coefficient (R) of 0.608 and weighted average of 15.8%, a difference of 38.5%.
Poverty Correlation Summary
| Measurement | Immigrants from Denmark | Immigrants from Somalia |
| Minimum | 1.9% | 2.7% |
| Maximum | 44.2% | 51.5% |
| Range | 42.3% | 48.8% |
| Mean | 11.0% | 17.3% |
| Median | 9.6% | 15.4% |
| Interquartile 25% (IQ1) | 7.1% | 12.1% |
| Interquartile 75% (IQ3) | 13.0% | 19.9% |
| Interquartile Range (IQR) | 5.9% | 7.8% |
| Standard Deviation (Sample) | 7.5% | 8.5% |
| Standard Deviation (Population) | 7.4% | 8.4% |
Similar Demographics by Poverty
Demographics Similar to Immigrants from Denmark by Poverty
In terms of poverty, the demographic groups most similar to Immigrants from Denmark are Finnish (11.4%, a difference of 0.13%), Czechoslovakian (11.4%, a difference of 0.17%), Belgian (11.4%, a difference of 0.20%), British (11.4%, a difference of 0.27%), and Romanian (11.4%, a difference of 0.31%).
| Demographics | Rating | Rank | Poverty |
| Immigrants | Sweden | 96.3 /100 | #83 | Exceptional 11.3% |
| English | 96.3 /100 | #84 | Exceptional 11.3% |
| Immigrants | England | 96.2 /100 | #85 | Exceptional 11.4% |
| Jordanians | 96.0 /100 | #86 | Exceptional 11.4% |
| Northern Europeans | 96.0 /100 | #87 | Exceptional 11.4% |
| Belgians | 95.8 /100 | #88 | Exceptional 11.4% |
| Czechoslovakians | 95.7 /100 | #89 | Exceptional 11.4% |
| Immigrants | Denmark | 95.5 /100 | #90 | Exceptional 11.4% |
| Finns | 95.2 /100 | #91 | Exceptional 11.4% |
| British | 95.0 /100 | #92 | Exceptional 11.4% |
| Romanians | 94.9 /100 | #93 | Exceptional 11.4% |
| Paraguayans | 94.9 /100 | #94 | Exceptional 11.4% |
| Australians | 94.9 /100 | #95 | Exceptional 11.4% |
| Immigrants | South Africa | 94.7 /100 | #96 | Exceptional 11.5% |
| Immigrants | Egypt | 94.6 /100 | #97 | Exceptional 11.5% |
Demographics Similar to Immigrants from Somalia by Poverty
In terms of poverty, the demographic groups most similar to Immigrants from Somalia are Immigrants from Grenada (15.8%, a difference of 0.12%), British West Indian (15.9%, a difference of 0.37%), Honduran (15.9%, a difference of 0.37%), Cajun (15.7%, a difference of 0.56%), and Chippewa (15.7%, a difference of 0.72%).
| Demographics | Rating | Rank | Poverty |
| Africans | 0.0 /100 | #307 | Tragic 15.6% |
| Choctaw | 0.0 /100 | #308 | Tragic 15.6% |
| Seminole | 0.0 /100 | #309 | Tragic 15.6% |
| Dutch West Indians | 0.0 /100 | #310 | Tragic 15.6% |
| Chippewa | 0.0 /100 | #311 | Tragic 15.7% |
| Cajuns | 0.0 /100 | #312 | Tragic 15.7% |
| Immigrants | Grenada | 0.0 /100 | #313 | Tragic 15.8% |
| Immigrants | Somalia | 0.0 /100 | #314 | Tragic 15.8% |
| British West Indians | 0.0 /100 | #315 | Tragic 15.9% |
| Hondurans | 0.0 /100 | #316 | Tragic 15.9% |
| U.S. Virgin Islanders | 0.0 /100 | #317 | Tragic 16.1% |
| Immigrants | Dominica | 0.0 /100 | #318 | Tragic 16.1% |
| Immigrants | Congo | 0.0 /100 | #319 | Tragic 16.1% |
| Immigrants | Honduras | 0.0 /100 | #320 | Tragic 16.2% |
| Arapaho | 0.0 /100 | #321 | Tragic 16.3% |