Immigrants from Denmark vs European Poverty
COMPARE
Immigrants from Denmark
European
Poverty
Poverty Comparison
Immigrants from Denmark
Europeans
11.4%
POVERTY
95.5/ 100
METRIC RATING
90th/ 347
METRIC RANK
11.3%
POVERTY
97.2/ 100
METRIC RATING
72nd/ 347
METRIC RANK
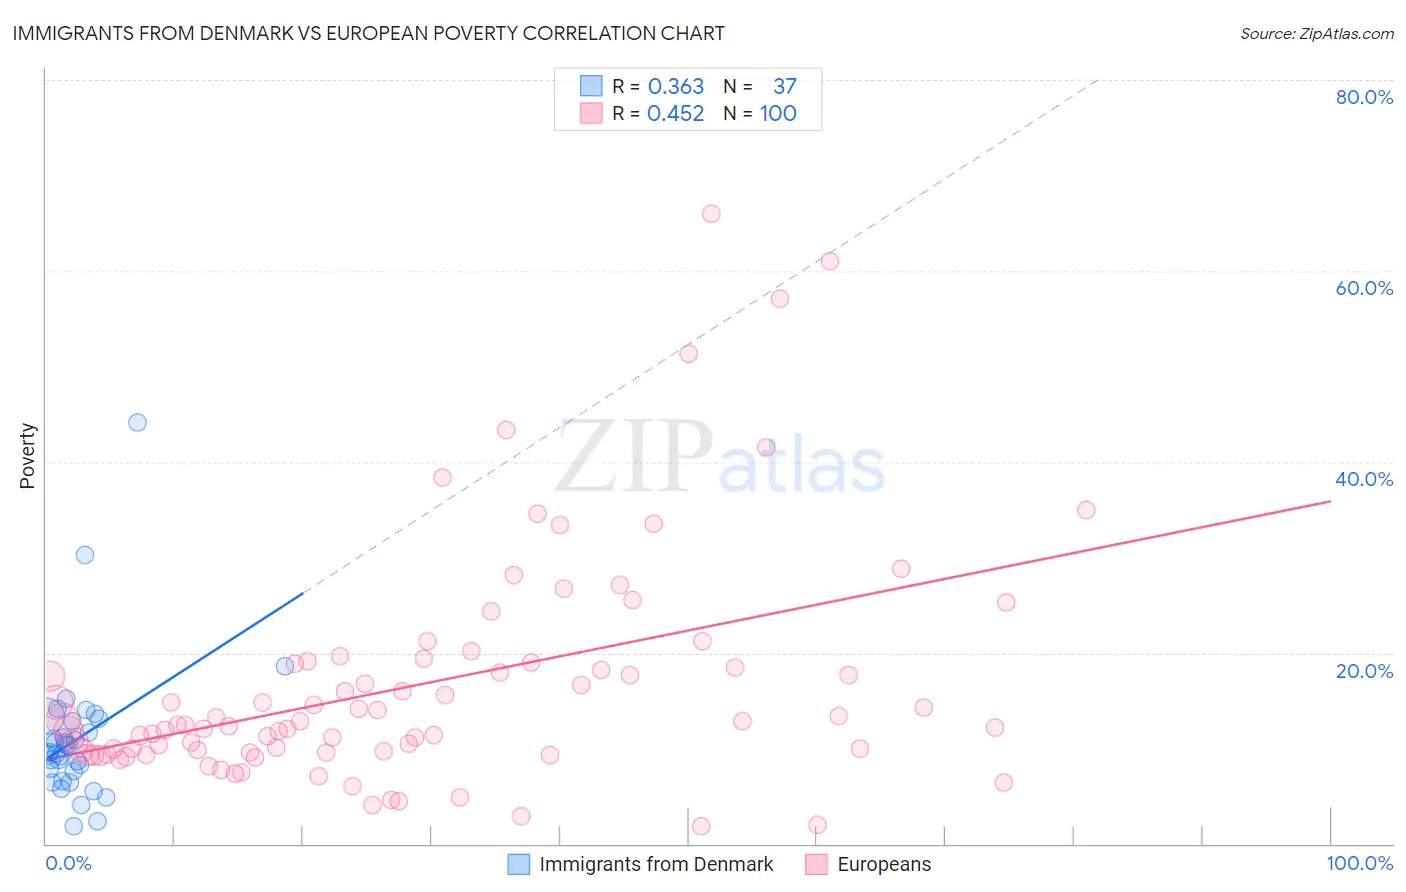
Immigrants from Denmark vs European Poverty Correlation Chart
The statistical analysis conducted on geographies consisting of 136,404,120 people shows a mild positive correlation between the proportion of Immigrants from Denmark and poverty level in the United States with a correlation coefficient (R) of 0.363 and weighted average of 11.4%. Similarly, the statistical analysis conducted on geographies consisting of 561,084,315 people shows a moderate positive correlation between the proportion of Europeans and poverty level in the United States with a correlation coefficient (R) of 0.452 and weighted average of 11.3%, a difference of 1.4%.
Poverty Correlation Summary
| Measurement | Immigrants from Denmark | European |
| Minimum | 1.9% | 1.9% |
| Maximum | 44.2% | 66.0% |
| Range | 42.3% | 64.1% |
| Mean | 11.0% | 16.6% |
| Median | 9.6% | 12.4% |
| Interquartile 25% (IQ1) | 7.1% | 9.6% |
| Interquartile 75% (IQ3) | 13.0% | 19.0% |
| Interquartile Range (IQR) | 5.9% | 9.3% |
| Standard Deviation (Sample) | 7.5% | 12.1% |
| Standard Deviation (Population) | 7.4% | 12.0% |
Demographics Similar to Immigrants from Denmark and Europeans by Poverty
In terms of poverty, the demographic groups most similar to Immigrants from Denmark are Finnish (11.4%, a difference of 0.13%), Czechoslovakian (11.4%, a difference of 0.17%), Belgian (11.4%, a difference of 0.20%), Northern European (11.4%, a difference of 0.34%), and Jordanian (11.4%, a difference of 0.35%). Similarly, the demographic groups most similar to Europeans are Immigrants from Belgium (11.3%, a difference of 0.0%), Zimbabwean (11.3%, a difference of 0.020%), Carpatho Rusyn (11.3%, a difference of 0.050%), Immigrants from Eastern Europe (11.3%, a difference of 0.24%), and Immigrants from North America (11.3%, a difference of 0.40%).
| Demographics | Rating | Rank | Poverty |
| Zimbabweans | 97.3 /100 | #71 | Exceptional 11.3% |
| Europeans | 97.2 /100 | #72 | Exceptional 11.3% |
| Immigrants | Belgium | 97.2 /100 | #73 | Exceptional 11.3% |
| Carpatho Rusyns | 97.2 /100 | #74 | Exceptional 11.3% |
| Immigrants | Eastern Europe | 97.0 /100 | #75 | Exceptional 11.3% |
| Immigrants | North America | 96.8 /100 | #76 | Exceptional 11.3% |
| Immigrants | Eastern Asia | 96.7 /100 | #77 | Exceptional 11.3% |
| Dutch | 96.7 /100 | #78 | Exceptional 11.3% |
| Cambodians | 96.7 /100 | #79 | Exceptional 11.3% |
| Indians (Asian) | 96.6 /100 | #80 | Exceptional 11.3% |
| Irish | 96.6 /100 | #81 | Exceptional 11.3% |
| Egyptians | 96.5 /100 | #82 | Exceptional 11.3% |
| Immigrants | Sweden | 96.3 /100 | #83 | Exceptional 11.3% |
| English | 96.3 /100 | #84 | Exceptional 11.3% |
| Immigrants | England | 96.2 /100 | #85 | Exceptional 11.4% |
| Jordanians | 96.0 /100 | #86 | Exceptional 11.4% |
| Northern Europeans | 96.0 /100 | #87 | Exceptional 11.4% |
| Belgians | 95.8 /100 | #88 | Exceptional 11.4% |
| Czechoslovakians | 95.7 /100 | #89 | Exceptional 11.4% |
| Immigrants | Denmark | 95.5 /100 | #90 | Exceptional 11.4% |
| Finns | 95.2 /100 | #91 | Exceptional 11.4% |