Immigrants from Denmark vs Australian Poverty
COMPARE
Immigrants from Denmark
Australian
Poverty
Poverty Comparison
Immigrants from Denmark
Australians
11.4%
POVERTY
95.5/ 100
METRIC RATING
90th/ 347
METRIC RANK
11.4%
POVERTY
94.9/ 100
METRIC RATING
95th/ 347
METRIC RANK
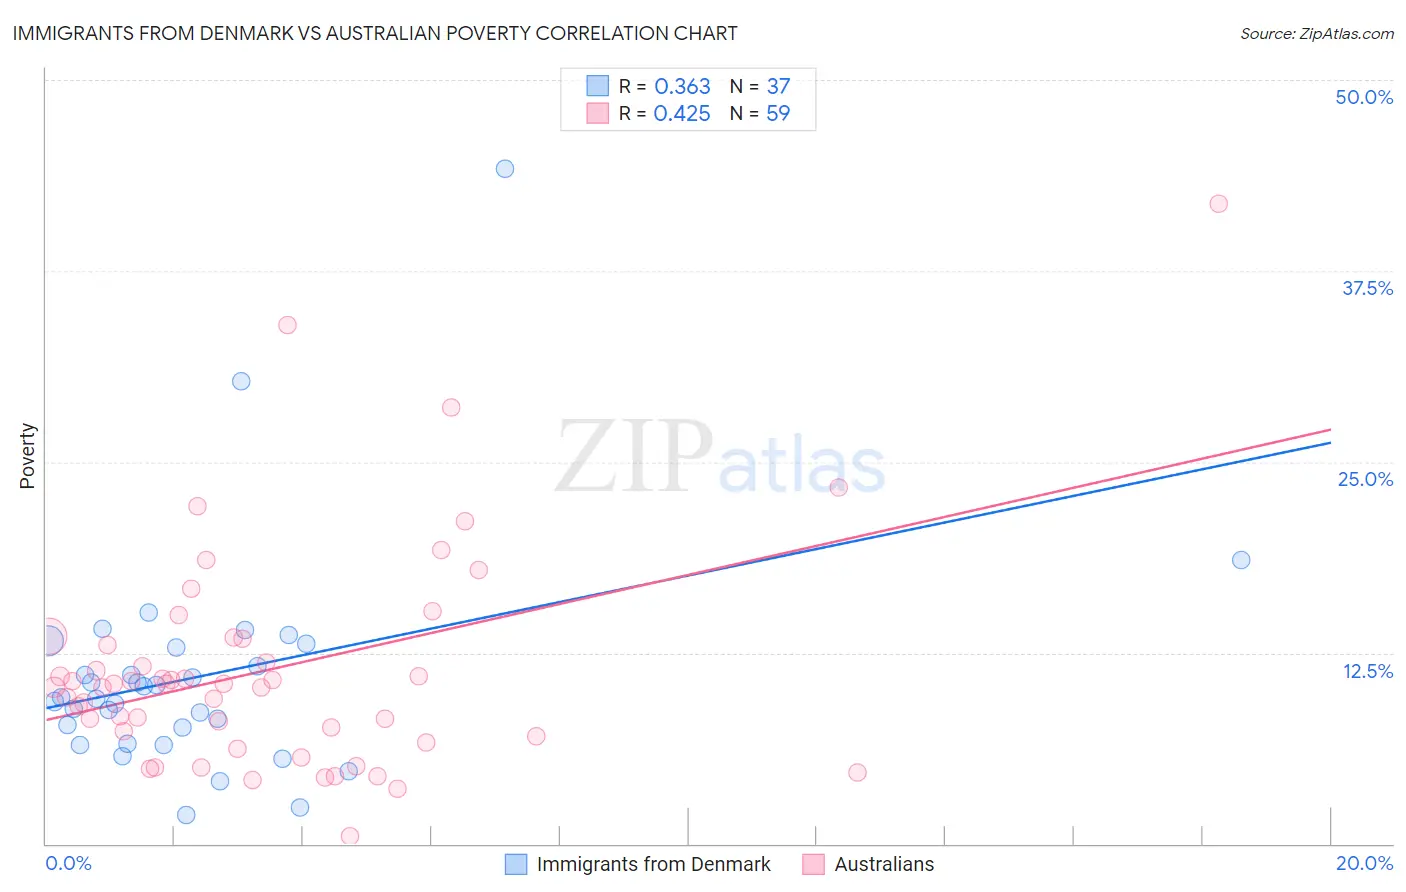
Immigrants from Denmark vs Australian Poverty Correlation Chart
The statistical analysis conducted on geographies consisting of 136,404,120 people shows a mild positive correlation between the proportion of Immigrants from Denmark and poverty level in the United States with a correlation coefficient (R) of 0.363 and weighted average of 11.4%. Similarly, the statistical analysis conducted on geographies consisting of 224,020,538 people shows a moderate positive correlation between the proportion of Australians and poverty level in the United States with a correlation coefficient (R) of 0.425 and weighted average of 11.4%, a difference of 0.33%.
Poverty Correlation Summary
| Measurement | Immigrants from Denmark | Australian |
| Minimum | 1.9% | 0.47% |
| Maximum | 44.2% | 41.9% |
| Range | 42.3% | 41.4% |
| Mean | 11.0% | 11.4% |
| Median | 9.6% | 10.5% |
| Interquartile 25% (IQ1) | 7.1% | 7.0% |
| Interquartile 75% (IQ3) | 13.0% | 13.4% |
| Interquartile Range (IQR) | 5.9% | 6.4% |
| Standard Deviation (Sample) | 7.5% | 7.3% |
| Standard Deviation (Population) | 7.4% | 7.3% |
Demographics Similar to Immigrants from Denmark and Australians by Poverty
In terms of poverty, the demographic groups most similar to Immigrants from Denmark are Finnish (11.4%, a difference of 0.13%), Czechoslovakian (11.4%, a difference of 0.17%), Belgian (11.4%, a difference of 0.20%), British (11.4%, a difference of 0.27%), and Romanian (11.4%, a difference of 0.31%). Similarly, the demographic groups most similar to Australians are Paraguayan (11.4%, a difference of 0.0%), Romanian (11.4%, a difference of 0.020%), British (11.4%, a difference of 0.060%), Immigrants from South Africa (11.5%, a difference of 0.12%), and Immigrants from Egypt (11.5%, a difference of 0.15%).
| Demographics | Rating | Rank | Poverty |
| Egyptians | 96.5 /100 | #82 | Exceptional 11.3% |
| Immigrants | Sweden | 96.3 /100 | #83 | Exceptional 11.3% |
| English | 96.3 /100 | #84 | Exceptional 11.3% |
| Immigrants | England | 96.2 /100 | #85 | Exceptional 11.4% |
| Jordanians | 96.0 /100 | #86 | Exceptional 11.4% |
| Northern Europeans | 96.0 /100 | #87 | Exceptional 11.4% |
| Belgians | 95.8 /100 | #88 | Exceptional 11.4% |
| Czechoslovakians | 95.7 /100 | #89 | Exceptional 11.4% |
| Immigrants | Denmark | 95.5 /100 | #90 | Exceptional 11.4% |
| Finns | 95.2 /100 | #91 | Exceptional 11.4% |
| British | 95.0 /100 | #92 | Exceptional 11.4% |
| Romanians | 94.9 /100 | #93 | Exceptional 11.4% |
| Paraguayans | 94.9 /100 | #94 | Exceptional 11.4% |
| Australians | 94.9 /100 | #95 | Exceptional 11.4% |
| Immigrants | South Africa | 94.7 /100 | #96 | Exceptional 11.5% |
| Immigrants | Egypt | 94.6 /100 | #97 | Exceptional 11.5% |
| Immigrants | Latvia | 94.5 /100 | #98 | Exceptional 11.5% |
| Immigrants | Indonesia | 94.2 /100 | #99 | Exceptional 11.5% |
| Scottish | 94.0 /100 | #100 | Exceptional 11.5% |
| Slavs | 93.3 /100 | #101 | Exceptional 11.5% |
| Laotians | 92.4 /100 | #102 | Exceptional 11.6% |