Immigrants from Denmark vs Immigrants from Switzerland Poverty
COMPARE
Immigrants from Denmark
Immigrants from Switzerland
Poverty
Poverty Comparison
Immigrants from Denmark
Immigrants from Switzerland
11.4%
POVERTY
95.5/ 100
METRIC RATING
90th/ 347
METRIC RANK
11.8%
POVERTY
83.0/ 100
METRIC RATING
137th/ 347
METRIC RANK
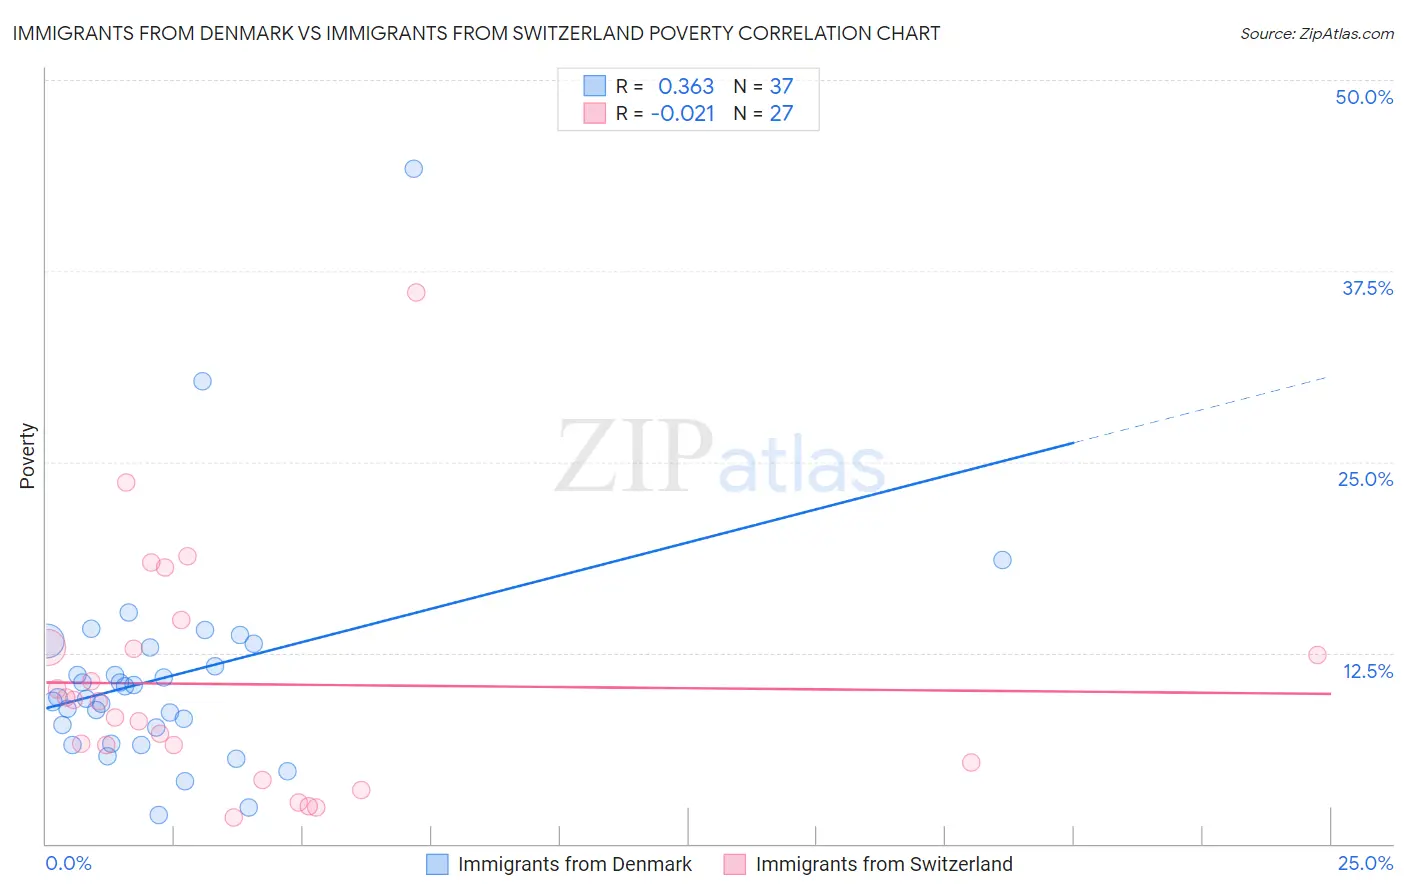
Immigrants from Denmark vs Immigrants from Switzerland Poverty Correlation Chart
The statistical analysis conducted on geographies consisting of 136,404,120 people shows a mild positive correlation between the proportion of Immigrants from Denmark and poverty level in the United States with a correlation coefficient (R) of 0.363 and weighted average of 11.4%. Similarly, the statistical analysis conducted on geographies consisting of 148,064,410 people shows no correlation between the proportion of Immigrants from Switzerland and poverty level in the United States with a correlation coefficient (R) of -0.021 and weighted average of 11.8%, a difference of 3.8%.
Poverty Correlation Summary
| Measurement | Immigrants from Denmark | Immigrants from Switzerland |
| Minimum | 1.9% | 1.7% |
| Maximum | 44.2% | 36.1% |
| Range | 42.3% | 34.3% |
| Mean | 11.0% | 10.4% |
| Median | 9.6% | 9.3% |
| Interquartile 25% (IQ1) | 7.1% | 5.3% |
| Interquartile 75% (IQ3) | 13.0% | 12.8% |
| Interquartile Range (IQR) | 5.9% | 7.6% |
| Standard Deviation (Sample) | 7.5% | 7.6% |
| Standard Deviation (Population) | 7.4% | 7.5% |
Similar Demographics by Poverty
Demographics Similar to Immigrants from Denmark by Poverty
In terms of poverty, the demographic groups most similar to Immigrants from Denmark are Finnish (11.4%, a difference of 0.13%), Czechoslovakian (11.4%, a difference of 0.17%), Belgian (11.4%, a difference of 0.20%), British (11.4%, a difference of 0.27%), and Romanian (11.4%, a difference of 0.31%).
| Demographics | Rating | Rank | Poverty |
| Immigrants | Sweden | 96.3 /100 | #83 | Exceptional 11.3% |
| English | 96.3 /100 | #84 | Exceptional 11.3% |
| Immigrants | England | 96.2 /100 | #85 | Exceptional 11.4% |
| Jordanians | 96.0 /100 | #86 | Exceptional 11.4% |
| Northern Europeans | 96.0 /100 | #87 | Exceptional 11.4% |
| Belgians | 95.8 /100 | #88 | Exceptional 11.4% |
| Czechoslovakians | 95.7 /100 | #89 | Exceptional 11.4% |
| Immigrants | Denmark | 95.5 /100 | #90 | Exceptional 11.4% |
| Finns | 95.2 /100 | #91 | Exceptional 11.4% |
| British | 95.0 /100 | #92 | Exceptional 11.4% |
| Romanians | 94.9 /100 | #93 | Exceptional 11.4% |
| Paraguayans | 94.9 /100 | #94 | Exceptional 11.4% |
| Australians | 94.9 /100 | #95 | Exceptional 11.4% |
| Immigrants | South Africa | 94.7 /100 | #96 | Exceptional 11.5% |
| Immigrants | Egypt | 94.6 /100 | #97 | Exceptional 11.5% |
Demographics Similar to Immigrants from Switzerland by Poverty
In terms of poverty, the demographic groups most similar to Immigrants from Switzerland are Immigrants from Jordan (11.9%, a difference of 0.11%), Pakistani (11.9%, a difference of 0.14%), Chilean (11.8%, a difference of 0.21%), Immigrants from Peru (11.9%, a difference of 0.33%), and Immigrants from Vietnam (11.8%, a difference of 0.41%).
| Demographics | Rating | Rank | Poverty |
| Immigrants | Ukraine | 86.6 /100 | #130 | Excellent 11.8% |
| French | 86.1 /100 | #131 | Excellent 11.8% |
| Peruvians | 85.6 /100 | #132 | Excellent 11.8% |
| Immigrants | Western Europe | 85.2 /100 | #133 | Excellent 11.8% |
| Yugoslavians | 85.2 /100 | #134 | Excellent 11.8% |
| Immigrants | Vietnam | 85.2 /100 | #135 | Excellent 11.8% |
| Chileans | 84.2 /100 | #136 | Excellent 11.8% |
| Immigrants | Switzerland | 83.0 /100 | #137 | Excellent 11.8% |
| Immigrants | Jordan | 82.4 /100 | #138 | Excellent 11.9% |
| Pakistanis | 82.2 /100 | #139 | Excellent 11.9% |
| Immigrants | Peru | 81.1 /100 | #140 | Excellent 11.9% |
| Immigrants | France | 80.5 /100 | #141 | Excellent 11.9% |
| Basques | 80.4 /100 | #142 | Excellent 11.9% |
| Brazilians | 79.7 /100 | #143 | Good 11.9% |
| Icelanders | 77.9 /100 | #144 | Good 11.9% |