Assyrian/Chaldean/Syriac vs Immigrants from Laos Poverty
COMPARE
Assyrian/Chaldean/Syriac
Immigrants from Laos
Poverty
Poverty Comparison
Assyrians/Chaldeans/Syriacs
Immigrants from Laos
10.1%
POVERTY
99.9/ 100
METRIC RATING
6th/ 347
METRIC RANK
13.8%
POVERTY
0.7/ 100
METRIC RATING
234th/ 347
METRIC RANK
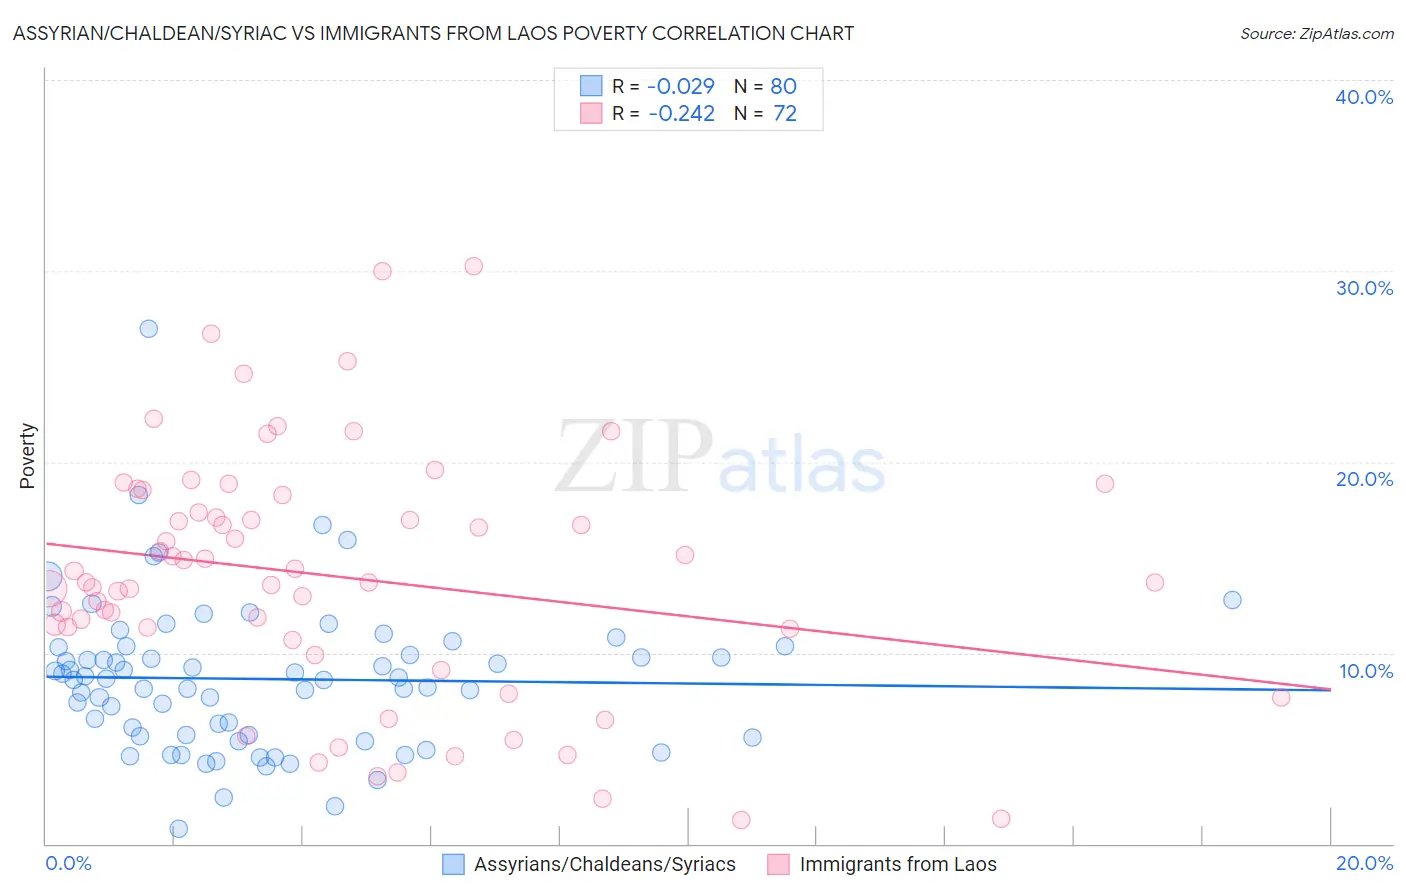
Assyrian/Chaldean/Syriac vs Immigrants from Laos Poverty Correlation Chart
The statistical analysis conducted on geographies consisting of 110,294,236 people shows no correlation between the proportion of Assyrians/Chaldeans/Syriacs and poverty level in the United States with a correlation coefficient (R) of -0.029 and weighted average of 10.1%. Similarly, the statistical analysis conducted on geographies consisting of 201,466,628 people shows a weak negative correlation between the proportion of Immigrants from Laos and poverty level in the United States with a correlation coefficient (R) of -0.242 and weighted average of 13.8%, a difference of 36.7%.
Poverty Correlation Summary
| Measurement | Assyrian/Chaldean/Syriac | Immigrants from Laos |
| Minimum | 0.75% | 1.2% |
| Maximum | 27.0% | 30.2% |
| Range | 26.2% | 29.0% |
| Mean | 8.6% | 14.0% |
| Median | 8.6% | 13.7% |
| Interquartile 25% (IQ1) | 5.7% | 11.0% |
| Interquartile 75% (IQ3) | 10.3% | 17.8% |
| Interquartile Range (IQR) | 4.6% | 6.8% |
| Standard Deviation (Sample) | 4.0% | 6.5% |
| Standard Deviation (Population) | 4.0% | 6.4% |
Similar Demographics by Poverty
Demographics Similar to Assyrians/Chaldeans/Syriacs by Poverty
In terms of poverty, the demographic groups most similar to Assyrians/Chaldeans/Syriacs are Filipino (10.1%, a difference of 0.14%), Immigrants from Ireland (10.1%, a difference of 0.18%), Maltese (10.2%, a difference of 0.56%), Immigrants from South Central Asia (10.2%, a difference of 1.0%), and Bulgarian (10.2%, a difference of 1.4%).
| Demographics | Rating | Rank | Poverty |
| Immigrants | India | 100.0 /100 | #1 | Exceptional 9.0% |
| Chinese | 100.0 /100 | #2 | Exceptional 9.5% |
| Thais | 100.0 /100 | #3 | Exceptional 9.6% |
| Immigrants | Taiwan | 100.0 /100 | #4 | Exceptional 9.7% |
| Immigrants | Ireland | 99.9 /100 | #5 | Exceptional 10.1% |
| Assyrians/Chaldeans/Syriacs | 99.9 /100 | #6 | Exceptional 10.1% |
| Filipinos | 99.9 /100 | #7 | Exceptional 10.1% |
| Maltese | 99.9 /100 | #8 | Exceptional 10.2% |
| Immigrants | South Central Asia | 99.9 /100 | #9 | Exceptional 10.2% |
| Bulgarians | 99.9 /100 | #10 | Exceptional 10.2% |
| Immigrants | Lithuania | 99.9 /100 | #11 | Exceptional 10.3% |
| Bhutanese | 99.8 /100 | #12 | Exceptional 10.4% |
| Immigrants | Hong Kong | 99.8 /100 | #13 | Exceptional 10.4% |
| Immigrants | Bolivia | 99.8 /100 | #14 | Exceptional 10.4% |
| Bolivians | 99.8 /100 | #15 | Exceptional 10.4% |
Demographics Similar to Immigrants from Laos by Poverty
In terms of poverty, the demographic groups most similar to Immigrants from Laos are Immigrants from Saudi Arabia (13.8%, a difference of 0.24%), Cuban (13.9%, a difference of 0.44%), Immigrants from Armenia (13.9%, a difference of 0.47%), Fijian (13.7%, a difference of 0.49%), and French American Indian (13.9%, a difference of 0.49%).
| Demographics | Rating | Rank | Poverty |
| Alaska Natives | 2.1 /100 | #227 | Tragic 13.5% |
| Immigrants | Nigeria | 1.7 /100 | #228 | Tragic 13.5% |
| Osage | 1.5 /100 | #229 | Tragic 13.6% |
| Alaskan Athabascans | 1.5 /100 | #230 | Tragic 13.6% |
| Nigerians | 1.4 /100 | #231 | Tragic 13.6% |
| Fijians | 0.8 /100 | #232 | Tragic 13.7% |
| Immigrants | Saudi Arabia | 0.8 /100 | #233 | Tragic 13.8% |
| Immigrants | Laos | 0.7 /100 | #234 | Tragic 13.8% |
| Cubans | 0.6 /100 | #235 | Tragic 13.9% |
| Immigrants | Armenia | 0.5 /100 | #236 | Tragic 13.9% |
| French American Indians | 0.5 /100 | #237 | Tragic 13.9% |
| Ghanaians | 0.5 /100 | #238 | Tragic 13.9% |
| Nicaraguans | 0.4 /100 | #239 | Tragic 13.9% |
| Immigrants | Middle Africa | 0.4 /100 | #240 | Tragic 14.0% |
| Salvadorans | 0.4 /100 | #241 | Tragic 14.0% |