Immigrants from Cuba vs Sioux Poverty
COMPARE
Immigrants from Cuba
Sioux
Poverty
Poverty Comparison
Immigrants from Cuba
Sioux
14.6%
POVERTY
0.1/ 100
METRIC RATING
269th/ 347
METRIC RANK
19.8%
POVERTY
0.0/ 100
METRIC RATING
337th/ 347
METRIC RANK
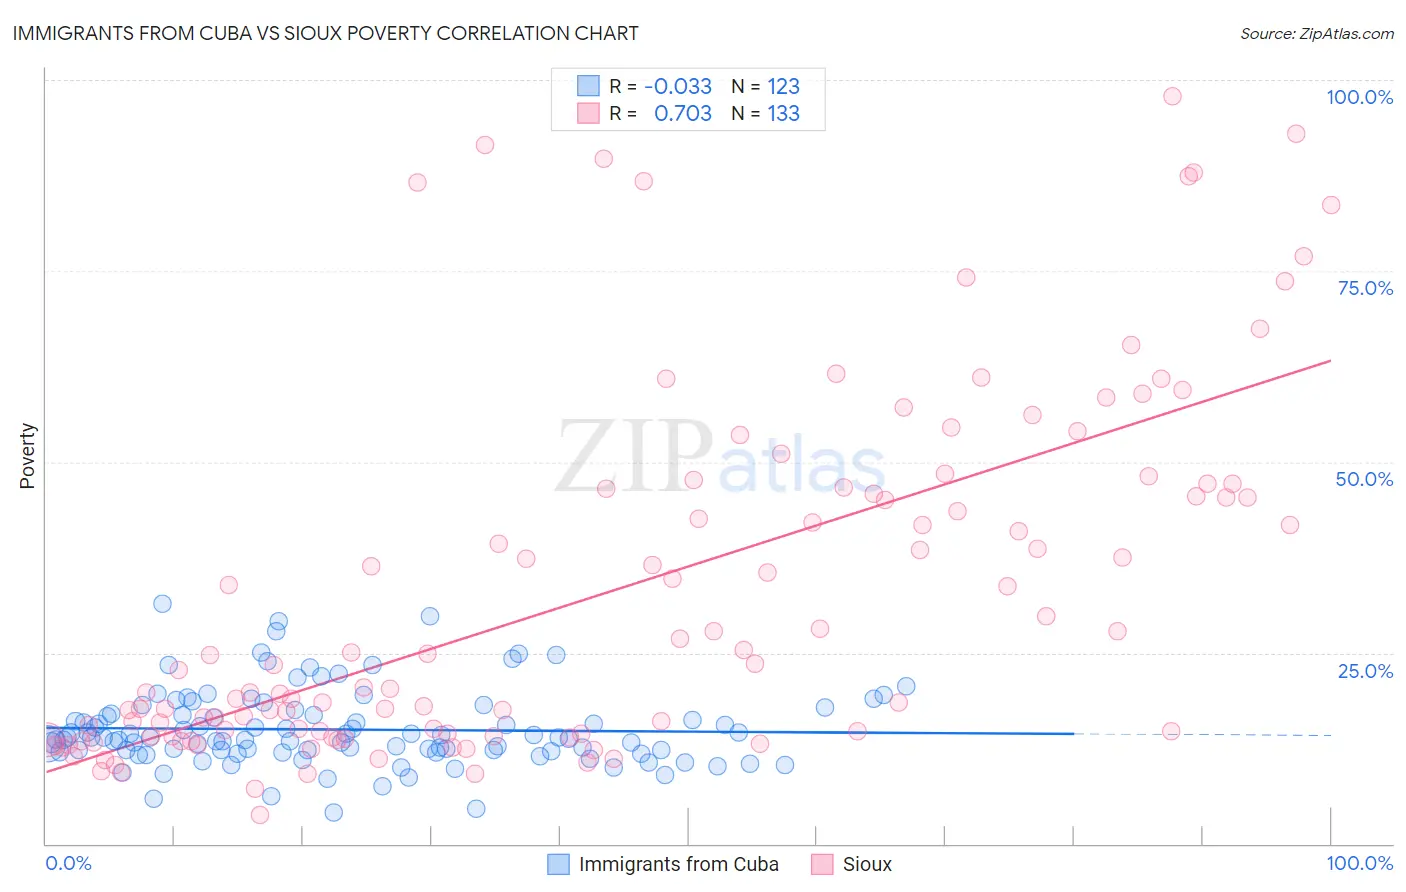
Immigrants from Cuba vs Sioux Poverty Correlation Chart
The statistical analysis conducted on geographies consisting of 325,967,480 people shows no correlation between the proportion of Immigrants from Cuba and poverty level in the United States with a correlation coefficient (R) of -0.033 and weighted average of 14.6%. Similarly, the statistical analysis conducted on geographies consisting of 234,110,660 people shows a strong positive correlation between the proportion of Sioux and poverty level in the United States with a correlation coefficient (R) of 0.703 and weighted average of 19.8%, a difference of 35.8%.
Poverty Correlation Summary
| Measurement | Immigrants from Cuba | Sioux |
| Minimum | 4.1% | 3.8% |
| Maximum | 31.4% | 97.9% |
| Range | 27.3% | 94.1% |
| Mean | 15.0% | 32.9% |
| Median | 13.9% | 23.5% |
| Interquartile 25% (IQ1) | 12.2% | 14.2% |
| Interquartile 75% (IQ3) | 17.1% | 46.5% |
| Interquartile Range (IQR) | 4.9% | 32.3% |
| Standard Deviation (Sample) | 5.0% | 23.2% |
| Standard Deviation (Population) | 5.0% | 23.1% |
Similar Demographics by Poverty
Demographics Similar to Immigrants from Cuba by Poverty
In terms of poverty, the demographic groups most similar to Immigrants from Cuba are Central American (14.6%, a difference of 0.14%), Subsaharan African (14.5%, a difference of 0.15%), Iroquois (14.5%, a difference of 0.19%), Guyanese (14.5%, a difference of 0.51%), and Immigrants from Guyana (14.5%, a difference of 0.68%).
| Demographics | Rating | Rank | Poverty |
| Immigrants | Liberia | 0.1 /100 | #262 | Tragic 14.4% |
| Jamaicans | 0.1 /100 | #263 | Tragic 14.4% |
| Immigrants | Jamaica | 0.1 /100 | #264 | Tragic 14.4% |
| Immigrants | Guyana | 0.1 /100 | #265 | Tragic 14.5% |
| Guyanese | 0.1 /100 | #266 | Tragic 14.5% |
| Iroquois | 0.1 /100 | #267 | Tragic 14.5% |
| Sub-Saharan Africans | 0.1 /100 | #268 | Tragic 14.5% |
| Immigrants | Cuba | 0.1 /100 | #269 | Tragic 14.6% |
| Central Americans | 0.1 /100 | #270 | Tragic 14.6% |
| Shoshone | 0.0 /100 | #271 | Tragic 14.7% |
| Chickasaw | 0.0 /100 | #272 | Tragic 14.7% |
| Spanish Americans | 0.0 /100 | #273 | Tragic 14.7% |
| Barbadians | 0.0 /100 | #274 | Tragic 14.8% |
| Immigrants | West Indies | 0.0 /100 | #275 | Tragic 14.8% |
| Immigrants | Bahamas | 0.0 /100 | #276 | Tragic 14.8% |
Demographics Similar to Sioux by Poverty
In terms of poverty, the demographic groups most similar to Sioux are Pueblo (19.4%, a difference of 1.9%), Yuman (20.2%, a difference of 2.2%), Cheyenne (18.9%, a difference of 4.4%), Crow (20.7%, a difference of 4.5%), and Yup'ik (20.8%, a difference of 5.2%).
| Demographics | Rating | Rank | Poverty |
| Dominicans | 0.0 /100 | #330 | Tragic 17.6% |
| Immigrants | Dominican Republic | 0.0 /100 | #331 | Tragic 17.8% |
| Natives/Alaskans | 0.0 /100 | #332 | Tragic 18.1% |
| Houma | 0.0 /100 | #333 | Tragic 18.4% |
| Apache | 0.0 /100 | #334 | Tragic 18.4% |
| Cheyenne | 0.0 /100 | #335 | Tragic 18.9% |
| Pueblo | 0.0 /100 | #336 | Tragic 19.4% |
| Sioux | 0.0 /100 | #337 | Tragic 19.8% |
| Yuman | 0.0 /100 | #338 | Tragic 20.2% |
| Crow | 0.0 /100 | #339 | Tragic 20.7% |
| Yup'ik | 0.0 /100 | #340 | Tragic 20.8% |
| Hopi | 0.0 /100 | #341 | Tragic 20.8% |
| Immigrants | Yemen | 0.0 /100 | #342 | Tragic 21.5% |
| Pima | 0.0 /100 | #343 | Tragic 21.9% |
| Lumbee | 0.0 /100 | #344 | Tragic 21.9% |