Immigrants from Cuba vs Immigrants from Greece Poverty
COMPARE
Immigrants from Cuba
Immigrants from Greece
Poverty
Poverty Comparison
Immigrants from Cuba
Immigrants from Greece
14.6%
POVERTY
0.1/ 100
METRIC RATING
269th/ 347
METRIC RANK
10.8%
POVERTY
99.3/ 100
METRIC RATING
37th/ 347
METRIC RANK
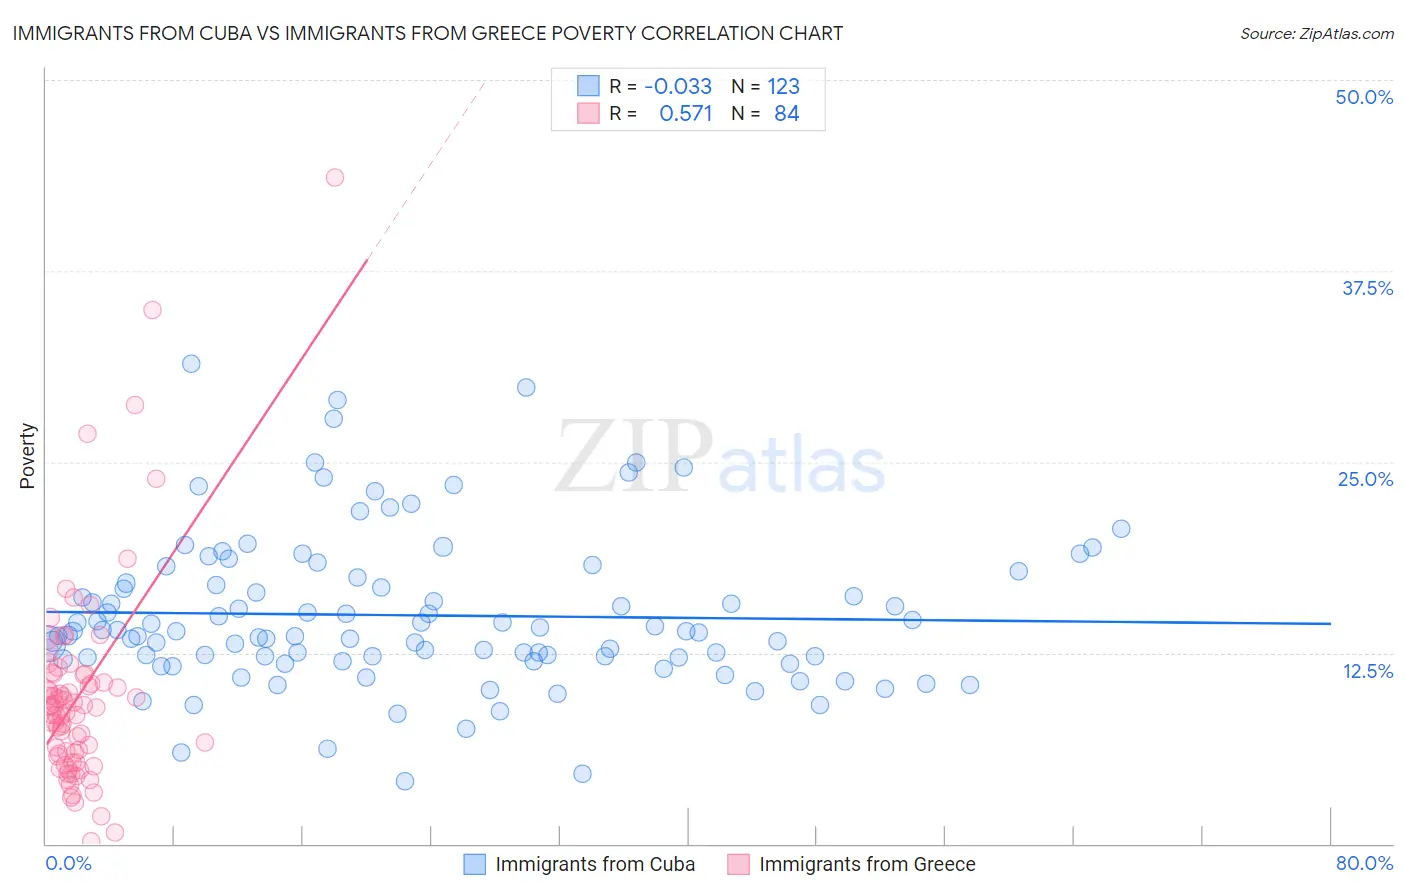
Immigrants from Cuba vs Immigrants from Greece Poverty Correlation Chart
The statistical analysis conducted on geographies consisting of 325,967,480 people shows no correlation between the proportion of Immigrants from Cuba and poverty level in the United States with a correlation coefficient (R) of -0.033 and weighted average of 14.6%. Similarly, the statistical analysis conducted on geographies consisting of 216,856,400 people shows a substantial positive correlation between the proportion of Immigrants from Greece and poverty level in the United States with a correlation coefficient (R) of 0.571 and weighted average of 10.8%, a difference of 34.4%.
Poverty Correlation Summary
| Measurement | Immigrants from Cuba | Immigrants from Greece |
| Minimum | 4.1% | 0.19% |
| Maximum | 31.4% | 43.6% |
| Range | 27.3% | 43.4% |
| Mean | 15.0% | 9.7% |
| Median | 13.9% | 8.9% |
| Interquartile 25% (IQ1) | 12.2% | 5.8% |
| Interquartile 75% (IQ3) | 17.1% | 11.1% |
| Interquartile Range (IQR) | 4.9% | 5.3% |
| Standard Deviation (Sample) | 5.0% | 6.8% |
| Standard Deviation (Population) | 5.0% | 6.8% |
Similar Demographics by Poverty
Demographics Similar to Immigrants from Cuba by Poverty
In terms of poverty, the demographic groups most similar to Immigrants from Cuba are Central American (14.6%, a difference of 0.14%), Subsaharan African (14.5%, a difference of 0.15%), Iroquois (14.5%, a difference of 0.19%), Guyanese (14.5%, a difference of 0.51%), and Immigrants from Guyana (14.5%, a difference of 0.68%).
| Demographics | Rating | Rank | Poverty |
| Immigrants | Liberia | 0.1 /100 | #262 | Tragic 14.4% |
| Jamaicans | 0.1 /100 | #263 | Tragic 14.4% |
| Immigrants | Jamaica | 0.1 /100 | #264 | Tragic 14.4% |
| Immigrants | Guyana | 0.1 /100 | #265 | Tragic 14.5% |
| Guyanese | 0.1 /100 | #266 | Tragic 14.5% |
| Iroquois | 0.1 /100 | #267 | Tragic 14.5% |
| Sub-Saharan Africans | 0.1 /100 | #268 | Tragic 14.5% |
| Immigrants | Cuba | 0.1 /100 | #269 | Tragic 14.6% |
| Central Americans | 0.1 /100 | #270 | Tragic 14.6% |
| Shoshone | 0.0 /100 | #271 | Tragic 14.7% |
| Chickasaw | 0.0 /100 | #272 | Tragic 14.7% |
| Spanish Americans | 0.0 /100 | #273 | Tragic 14.7% |
| Barbadians | 0.0 /100 | #274 | Tragic 14.8% |
| Immigrants | West Indies | 0.0 /100 | #275 | Tragic 14.8% |
| Immigrants | Bahamas | 0.0 /100 | #276 | Tragic 14.8% |
Demographics Similar to Immigrants from Greece by Poverty
In terms of poverty, the demographic groups most similar to Immigrants from Greece are Czech (10.8%, a difference of 0.050%), Cypriot (10.8%, a difference of 0.10%), Immigrants from Pakistan (10.8%, a difference of 0.13%), Tongan (10.8%, a difference of 0.17%), and Russian (10.9%, a difference of 0.18%).
| Demographics | Rating | Rank | Poverty |
| Danes | 99.5 /100 | #30 | Exceptional 10.7% |
| Poles | 99.5 /100 | #31 | Exceptional 10.7% |
| Iranians | 99.5 /100 | #32 | Exceptional 10.7% |
| Macedonians | 99.4 /100 | #33 | Exceptional 10.8% |
| Immigrants | Poland | 99.4 /100 | #34 | Exceptional 10.8% |
| Tongans | 99.4 /100 | #35 | Exceptional 10.8% |
| Cypriots | 99.3 /100 | #36 | Exceptional 10.8% |
| Immigrants | Greece | 99.3 /100 | #37 | Exceptional 10.8% |
| Czechs | 99.3 /100 | #38 | Exceptional 10.8% |
| Immigrants | Pakistan | 99.3 /100 | #39 | Exceptional 10.8% |
| Russians | 99.3 /100 | #40 | Exceptional 10.9% |
| Immigrants | Iran | 99.2 /100 | #41 | Exceptional 10.9% |
| Koreans | 99.2 /100 | #42 | Exceptional 10.9% |
| Immigrants | Singapore | 99.2 /100 | #43 | Exceptional 10.9% |
| Immigrants | Moldova | 99.1 /100 | #44 | Exceptional 10.9% |