Immigrants from Cuba vs Dominican Child Poverty Among Boys Under 16
COMPARE
Immigrants from Cuba
Dominican
Child Poverty Among Boys Under 16
Child Poverty Among Boys Under 16 Comparison
Immigrants from Cuba
Dominicans
18.8%
CHILD POVERTY AMONG BOYS UNDER 16
0.6/ 100
METRIC RATING
240th/ 347
METRIC RANK
24.2%
CHILD POVERTY AMONG BOYS UNDER 16
0.0/ 100
METRIC RATING
331st/ 347
METRIC RANK
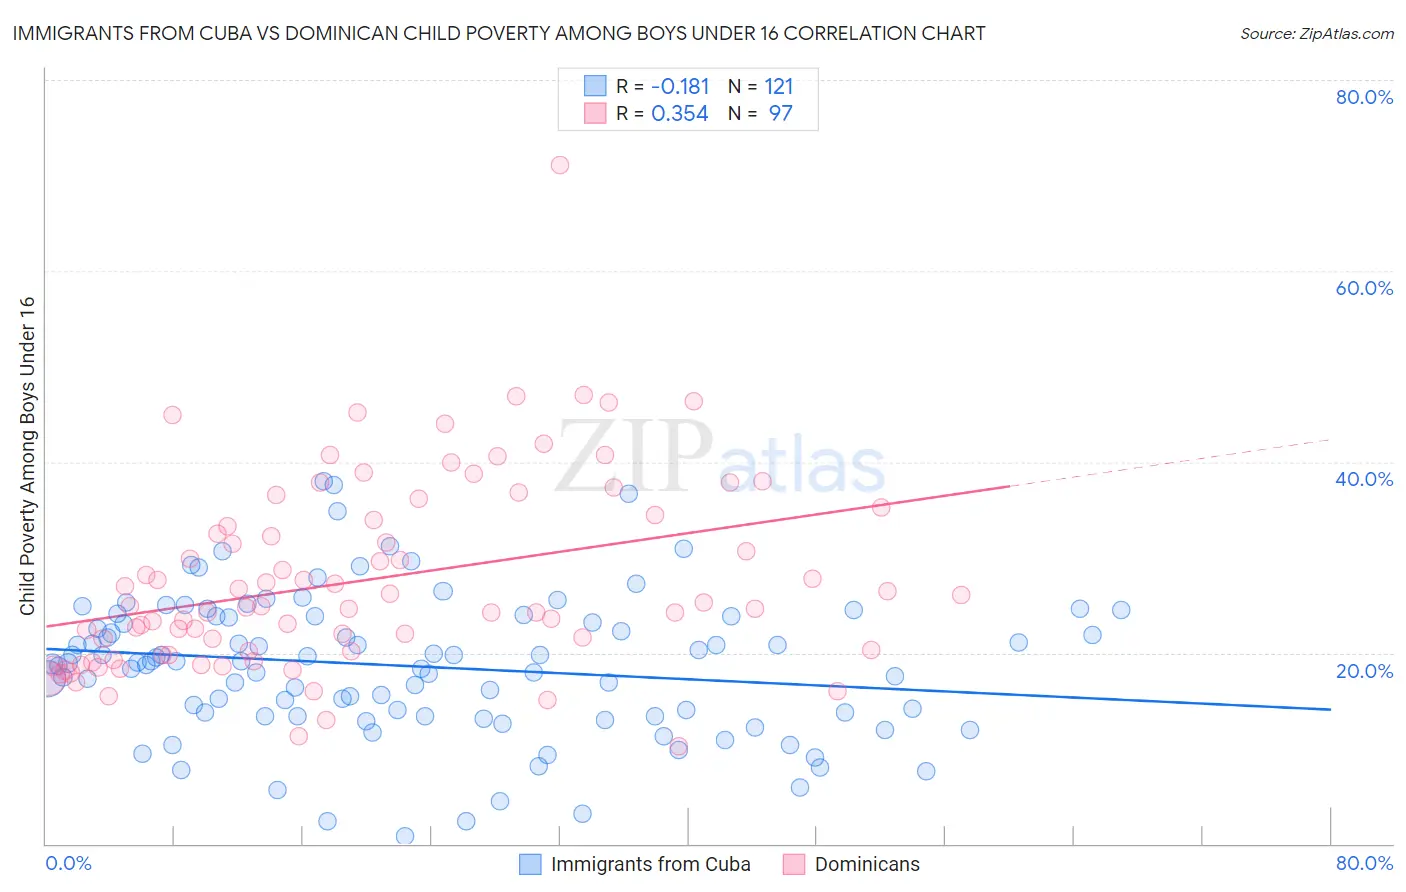
Immigrants from Cuba vs Dominican Child Poverty Among Boys Under 16 Correlation Chart
The statistical analysis conducted on geographies consisting of 321,856,633 people shows a poor negative correlation between the proportion of Immigrants from Cuba and poverty level among boys under the age of 16 in the United States with a correlation coefficient (R) of -0.181 and weighted average of 18.8%. Similarly, the statistical analysis conducted on geographies consisting of 349,767,755 people shows a mild positive correlation between the proportion of Dominicans and poverty level among boys under the age of 16 in the United States with a correlation coefficient (R) of 0.354 and weighted average of 24.2%, a difference of 28.8%.
Child Poverty Among Boys Under 16 Correlation Summary
| Measurement | Immigrants from Cuba | Dominican |
| Minimum | 0.84% | 10.2% |
| Maximum | 37.9% | 71.1% |
| Range | 37.1% | 60.8% |
| Mean | 18.6% | 27.6% |
| Median | 19.0% | 24.8% |
| Interquartile 25% (IQ1) | 13.4% | 20.0% |
| Interquartile 75% (IQ3) | 23.8% | 34.2% |
| Interquartile Range (IQR) | 10.4% | 14.2% |
| Standard Deviation (Sample) | 7.4% | 10.0% |
| Standard Deviation (Population) | 7.4% | 10.0% |
Similar Demographics by Child Poverty Among Boys Under 16
Demographics Similar to Immigrants from Cuba by Child Poverty Among Boys Under 16
In terms of child poverty among boys under 16, the demographic groups most similar to Immigrants from Cuba are Immigrants from Sudan (18.8%, a difference of 0.050%), Cape Verdean (18.7%, a difference of 0.34%), Ghanaian (18.9%, a difference of 0.56%), Immigrants from Laos (18.7%, a difference of 0.57%), and Immigrants from Eritrea (18.6%, a difference of 0.79%).
| Demographics | Rating | Rank | Child Poverty Among Boys Under 16 |
| Immigrants | Nigeria | 1.2 /100 | #233 | Tragic 18.4% |
| Nigerians | 1.1 /100 | #234 | Tragic 18.5% |
| Americans | 0.9 /100 | #235 | Tragic 18.6% |
| Sudanese | 0.9 /100 | #236 | Tragic 18.6% |
| Immigrants | Eritrea | 0.8 /100 | #237 | Tragic 18.6% |
| Immigrants | Laos | 0.8 /100 | #238 | Tragic 18.7% |
| Cape Verdeans | 0.7 /100 | #239 | Tragic 18.7% |
| Immigrants | Cuba | 0.6 /100 | #240 | Tragic 18.8% |
| Immigrants | Sudan | 0.6 /100 | #241 | Tragic 18.8% |
| Ghanaians | 0.5 /100 | #242 | Tragic 18.9% |
| Immigrants | Azores | 0.4 /100 | #243 | Tragic 18.9% |
| Immigrants | Middle Africa | 0.4 /100 | #244 | Tragic 18.9% |
| Cree | 0.4 /100 | #245 | Tragic 19.0% |
| Immigrants | Nicaragua | 0.4 /100 | #246 | Tragic 19.0% |
| Immigrants | Trinidad and Tobago | 0.3 /100 | #247 | Tragic 19.0% |
Demographics Similar to Dominicans by Child Poverty Among Boys Under 16
In terms of child poverty among boys under 16, the demographic groups most similar to Dominicans are Colville (24.1%, a difference of 0.34%), Immigrants from Dominican Republic (24.3%, a difference of 0.59%), Native/Alaskan (24.0%, a difference of 0.92%), Apache (24.5%, a difference of 1.3%), and Black/African American (24.5%, a difference of 1.4%).
| Demographics | Rating | Rank | Child Poverty Among Boys Under 16 |
| Immigrants | Congo | 0.0 /100 | #324 | Tragic 22.4% |
| Central American Indians | 0.0 /100 | #325 | Tragic 22.5% |
| Paiute | 0.0 /100 | #326 | Tragic 22.8% |
| Immigrants | Honduras | 0.0 /100 | #327 | Tragic 22.8% |
| Pueblo | 0.0 /100 | #328 | Tragic 23.5% |
| Natives/Alaskans | 0.0 /100 | #329 | Tragic 24.0% |
| Colville | 0.0 /100 | #330 | Tragic 24.1% |
| Dominicans | 0.0 /100 | #331 | Tragic 24.2% |
| Immigrants | Dominican Republic | 0.0 /100 | #332 | Tragic 24.3% |
| Apache | 0.0 /100 | #333 | Tragic 24.5% |
| Blacks/African Americans | 0.0 /100 | #334 | Tragic 24.5% |
| Yup'ik | 0.0 /100 | #335 | Tragic 24.7% |
| Sioux | 0.0 /100 | #336 | Tragic 25.3% |
| Cheyenne | 0.0 /100 | #337 | Tragic 25.8% |
| Hopi | 0.0 /100 | #338 | Tragic 25.9% |