Immigrants from Cuba vs Immigrants from Thailand Child Poverty Among Boys Under 16
COMPARE
Immigrants from Cuba
Immigrants from Thailand
Child Poverty Among Boys Under 16
Child Poverty Among Boys Under 16 Comparison
Immigrants from Cuba
Immigrants from Thailand
18.8%
CHILD POVERTY AMONG BOYS UNDER 16
0.6/ 100
METRIC RATING
240th/ 347
METRIC RANK
17.5%
CHILD POVERTY AMONG BOYS UNDER 16
8.2/ 100
METRIC RATING
207th/ 347
METRIC RANK
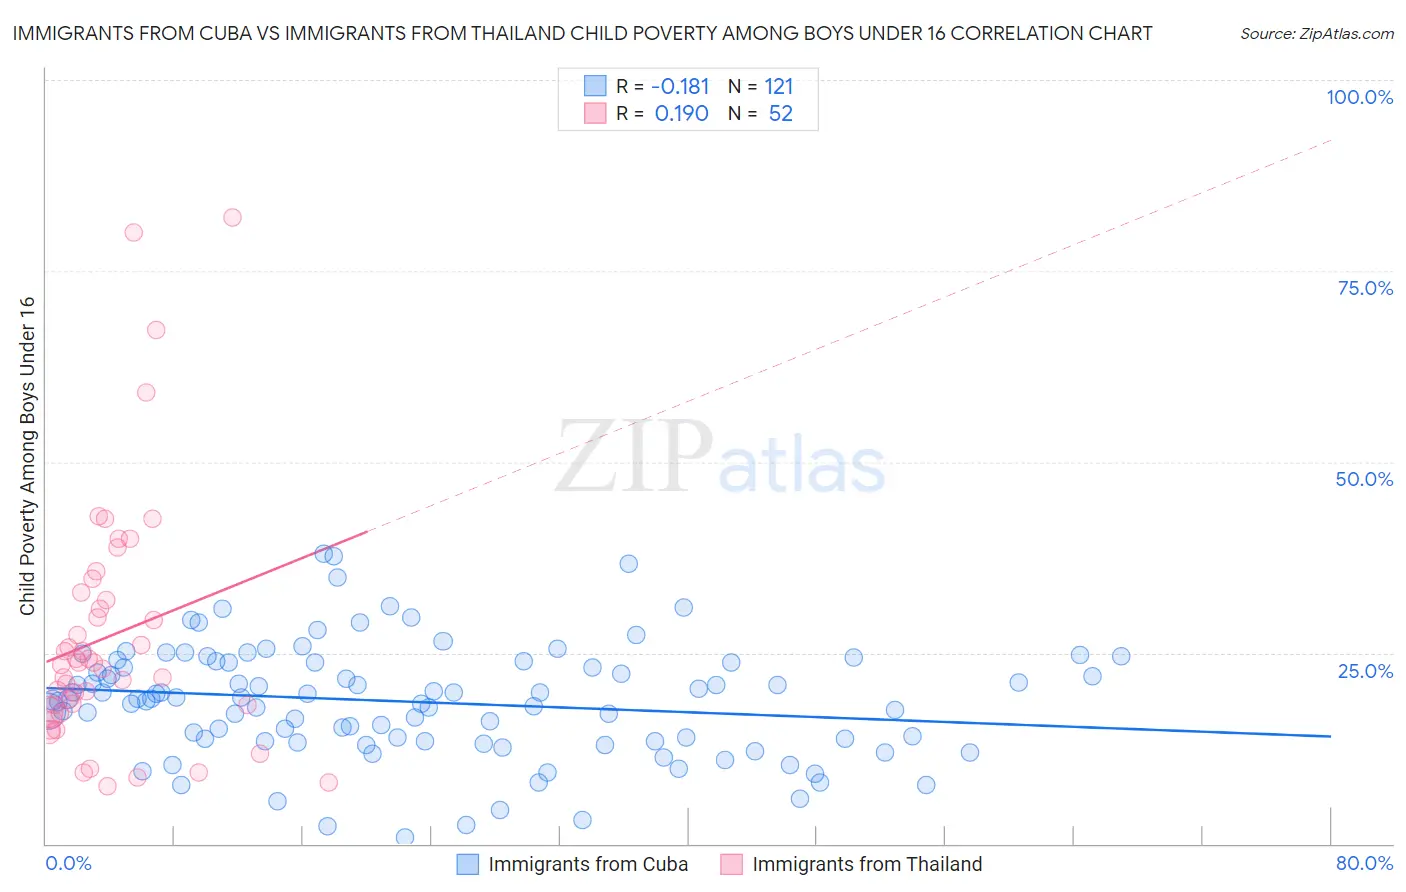
Immigrants from Cuba vs Immigrants from Thailand Child Poverty Among Boys Under 16 Correlation Chart
The statistical analysis conducted on geographies consisting of 321,856,633 people shows a poor negative correlation between the proportion of Immigrants from Cuba and poverty level among boys under the age of 16 in the United States with a correlation coefficient (R) of -0.181 and weighted average of 18.8%. Similarly, the statistical analysis conducted on geographies consisting of 313,818,452 people shows a poor positive correlation between the proportion of Immigrants from Thailand and poverty level among boys under the age of 16 in the United States with a correlation coefficient (R) of 0.190 and weighted average of 17.5%, a difference of 7.0%.
Child Poverty Among Boys Under 16 Correlation Summary
| Measurement | Immigrants from Cuba | Immigrants from Thailand |
| Minimum | 0.84% | 7.6% |
| Maximum | 37.9% | 82.1% |
| Range | 37.1% | 74.5% |
| Mean | 18.6% | 27.1% |
| Median | 19.0% | 23.5% |
| Interquartile 25% (IQ1) | 13.4% | 17.7% |
| Interquartile 75% (IQ3) | 23.8% | 32.4% |
| Interquartile Range (IQR) | 10.4% | 14.7% |
| Standard Deviation (Sample) | 7.4% | 16.3% |
| Standard Deviation (Population) | 7.4% | 16.1% |
Similar Demographics by Child Poverty Among Boys Under 16
Demographics Similar to Immigrants from Cuba by Child Poverty Among Boys Under 16
In terms of child poverty among boys under 16, the demographic groups most similar to Immigrants from Cuba are Immigrants from Sudan (18.8%, a difference of 0.050%), Cape Verdean (18.7%, a difference of 0.34%), Ghanaian (18.9%, a difference of 0.56%), Immigrants from Laos (18.7%, a difference of 0.57%), and Immigrants from Eritrea (18.6%, a difference of 0.79%).
| Demographics | Rating | Rank | Child Poverty Among Boys Under 16 |
| Immigrants | Nigeria | 1.2 /100 | #233 | Tragic 18.4% |
| Nigerians | 1.1 /100 | #234 | Tragic 18.5% |
| Americans | 0.9 /100 | #235 | Tragic 18.6% |
| Sudanese | 0.9 /100 | #236 | Tragic 18.6% |
| Immigrants | Eritrea | 0.8 /100 | #237 | Tragic 18.6% |
| Immigrants | Laos | 0.8 /100 | #238 | Tragic 18.7% |
| Cape Verdeans | 0.7 /100 | #239 | Tragic 18.7% |
| Immigrants | Cuba | 0.6 /100 | #240 | Tragic 18.8% |
| Immigrants | Sudan | 0.6 /100 | #241 | Tragic 18.8% |
| Ghanaians | 0.5 /100 | #242 | Tragic 18.9% |
| Immigrants | Azores | 0.4 /100 | #243 | Tragic 18.9% |
| Immigrants | Middle Africa | 0.4 /100 | #244 | Tragic 18.9% |
| Cree | 0.4 /100 | #245 | Tragic 19.0% |
| Immigrants | Nicaragua | 0.4 /100 | #246 | Tragic 19.0% |
| Immigrants | Trinidad and Tobago | 0.3 /100 | #247 | Tragic 19.0% |
Demographics Similar to Immigrants from Thailand by Child Poverty Among Boys Under 16
In terms of child poverty among boys under 16, the demographic groups most similar to Immigrants from Thailand are Malaysian (17.6%, a difference of 0.22%), Alaskan Athabascan (17.6%, a difference of 0.32%), Immigrants from Armenia (17.6%, a difference of 0.50%), Immigrants (17.6%, a difference of 0.56%), and Aleut (17.7%, a difference of 0.61%).
| Demographics | Rating | Rank | Child Poverty Among Boys Under 16 |
| Immigrants | Uruguay | 16.9 /100 | #200 | Poor 17.2% |
| Immigrants | Afghanistan | 13.7 /100 | #201 | Poor 17.3% |
| Immigrants | Sierra Leone | 13.4 /100 | #202 | Poor 17.3% |
| Immigrants | Uzbekistan | 13.3 /100 | #203 | Poor 17.3% |
| Ugandans | 12.5 /100 | #204 | Poor 17.3% |
| Immigrants | Portugal | 11.2 /100 | #205 | Poor 17.4% |
| German Russians | 10.9 /100 | #206 | Poor 17.4% |
| Immigrants | Thailand | 8.2 /100 | #207 | Tragic 17.5% |
| Malaysians | 7.6 /100 | #208 | Tragic 17.6% |
| Alaskan Athabascans | 7.3 /100 | #209 | Tragic 17.6% |
| Immigrants | Armenia | 6.8 /100 | #210 | Tragic 17.6% |
| Immigrants | Immigrants | 6.7 /100 | #211 | Tragic 17.6% |
| Aleuts | 6.6 /100 | #212 | Tragic 17.7% |
| Immigrants | Eastern Africa | 6.0 /100 | #213 | Tragic 17.7% |
| Panamanians | 5.9 /100 | #214 | Tragic 17.7% |