Dutch vs Immigrants from Austria Poverty
COMPARE
Dutch
Immigrants from Austria
Poverty
Poverty Comparison
Dutch
Immigrants from Austria
11.3%
POVERTY
96.7/ 100
METRIC RATING
78th/ 347
METRIC RANK
11.1%
POVERTY
98.6/ 100
METRIC RATING
53rd/ 347
METRIC RANK
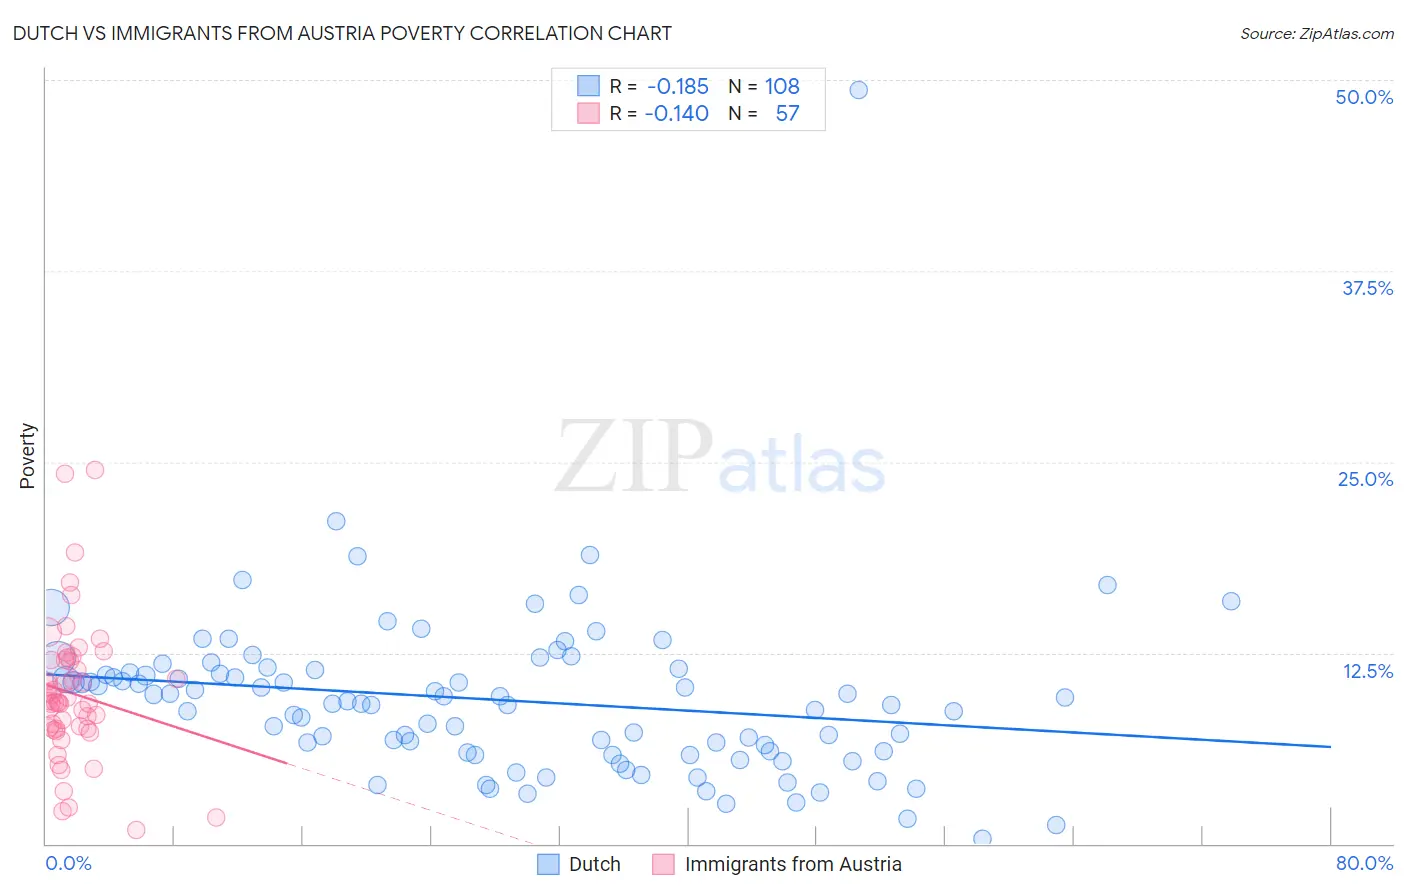
Dutch vs Immigrants from Austria Poverty Correlation Chart
The statistical analysis conducted on geographies consisting of 553,673,360 people shows a poor negative correlation between the proportion of Dutch and poverty level in the United States with a correlation coefficient (R) of -0.185 and weighted average of 11.3%. Similarly, the statistical analysis conducted on geographies consisting of 167,938,578 people shows a poor negative correlation between the proportion of Immigrants from Austria and poverty level in the United States with a correlation coefficient (R) of -0.140 and weighted average of 11.1%, a difference of 2.3%.
Poverty Correlation Summary
| Measurement | Dutch | Immigrants from Austria |
| Minimum | 0.35% | 0.88% |
| Maximum | 49.4% | 24.4% |
| Range | 49.0% | 23.6% |
| Mean | 9.4% | 9.8% |
| Median | 9.3% | 9.3% |
| Interquartile 25% (IQ1) | 6.0% | 7.5% |
| Interquartile 75% (IQ3) | 11.3% | 12.1% |
| Interquartile Range (IQR) | 5.3% | 4.5% |
| Standard Deviation (Sample) | 5.6% | 4.5% |
| Standard Deviation (Population) | 5.6% | 4.5% |
Similar Demographics by Poverty
Demographics Similar to Dutch by Poverty
In terms of poverty, the demographic groups most similar to Dutch are Immigrants from Eastern Asia (11.3%, a difference of 0.010%), Cambodian (11.3%, a difference of 0.040%), Indian (Asian) (11.3%, a difference of 0.060%), Irish (11.3%, a difference of 0.070%), and Immigrants from North America (11.3%, a difference of 0.080%).
| Demographics | Rating | Rank | Poverty |
| Zimbabweans | 97.3 /100 | #71 | Exceptional 11.3% |
| Europeans | 97.2 /100 | #72 | Exceptional 11.3% |
| Immigrants | Belgium | 97.2 /100 | #73 | Exceptional 11.3% |
| Carpatho Rusyns | 97.2 /100 | #74 | Exceptional 11.3% |
| Immigrants | Eastern Europe | 97.0 /100 | #75 | Exceptional 11.3% |
| Immigrants | North America | 96.8 /100 | #76 | Exceptional 11.3% |
| Immigrants | Eastern Asia | 96.7 /100 | #77 | Exceptional 11.3% |
| Dutch | 96.7 /100 | #78 | Exceptional 11.3% |
| Cambodians | 96.7 /100 | #79 | Exceptional 11.3% |
| Indians (Asian) | 96.6 /100 | #80 | Exceptional 11.3% |
| Irish | 96.6 /100 | #81 | Exceptional 11.3% |
| Egyptians | 96.5 /100 | #82 | Exceptional 11.3% |
| Immigrants | Sweden | 96.3 /100 | #83 | Exceptional 11.3% |
| English | 96.3 /100 | #84 | Exceptional 11.3% |
| Immigrants | England | 96.2 /100 | #85 | Exceptional 11.4% |
Demographics Similar to Immigrants from Austria by Poverty
In terms of poverty, the demographic groups most similar to Immigrants from Austria are Immigrants from Bulgaria (11.1%, a difference of 0.12%), Immigrants from Serbia (11.1%, a difference of 0.15%), Immigrants from Philippines (11.0%, a difference of 0.23%), Immigrants from Croatia (11.0%, a difference of 0.24%), and Estonian (11.1%, a difference of 0.63%).
| Demographics | Rating | Rank | Poverty |
| Immigrants | Czechoslovakia | 98.9 /100 | #46 | Exceptional 11.0% |
| Immigrants | Romania | 98.9 /100 | #47 | Exceptional 11.0% |
| Slovenes | 98.9 /100 | #48 | Exceptional 11.0% |
| Immigrants | Japan | 98.9 /100 | #49 | Exceptional 11.0% |
| Asians | 98.9 /100 | #50 | Exceptional 11.0% |
| Immigrants | Croatia | 98.7 /100 | #51 | Exceptional 11.0% |
| Immigrants | Philippines | 98.7 /100 | #52 | Exceptional 11.0% |
| Immigrants | Austria | 98.6 /100 | #53 | Exceptional 11.1% |
| Immigrants | Bulgaria | 98.5 /100 | #54 | Exceptional 11.1% |
| Immigrants | Serbia | 98.5 /100 | #55 | Exceptional 11.1% |
| Estonians | 98.2 /100 | #56 | Exceptional 11.1% |
| Scandinavians | 98.2 /100 | #57 | Exceptional 11.1% |
| Germans | 98.1 /100 | #58 | Exceptional 11.1% |
| Immigrants | Europe | 98.0 /100 | #59 | Exceptional 11.2% |
| Immigrants | Sri Lanka | 97.9 /100 | #60 | Exceptional 11.2% |