Immigrants from Costa Rica vs Immigrants from Northern Europe Receiving Food Stamps
COMPARE
Immigrants from Costa Rica
Immigrants from Northern Europe
Receiving Food Stamps
Receiving Food Stamps Comparison
Immigrants from Costa Rica
Immigrants from Northern Europe
12.2%
RECEIVING FOOD STAMPS
25.4/ 100
METRIC RATING
198th/ 347
METRIC RANK
9.2%
RECEIVING FOOD STAMPS
99.8/ 100
METRIC RATING
24th/ 347
METRIC RANK
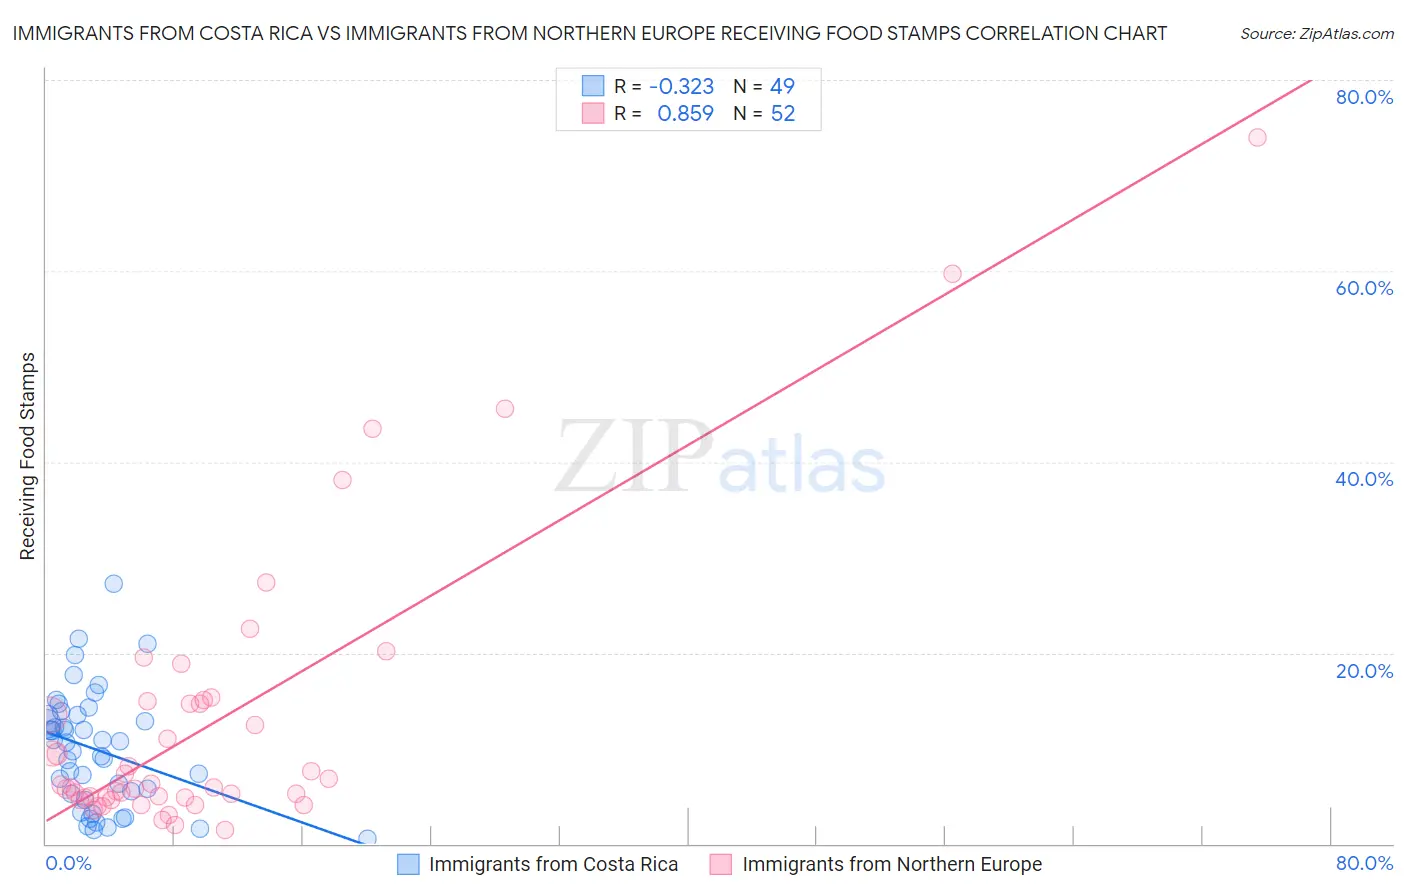
Immigrants from Costa Rica vs Immigrants from Northern Europe Receiving Food Stamps Correlation Chart
The statistical analysis conducted on geographies consisting of 204,093,870 people shows a mild negative correlation between the proportion of Immigrants from Costa Rica and percentage of population receiving government assistance and/or food stamps in the United States with a correlation coefficient (R) of -0.323 and weighted average of 12.2%. Similarly, the statistical analysis conducted on geographies consisting of 475,099,047 people shows a very strong positive correlation between the proportion of Immigrants from Northern Europe and percentage of population receiving government assistance and/or food stamps in the United States with a correlation coefficient (R) of 0.859 and weighted average of 9.2%, a difference of 32.9%.
Receiving Food Stamps Correlation Summary
| Measurement | Immigrants from Costa Rica | Immigrants from Northern Europe |
| Minimum | 0.50% | 1.5% |
| Maximum | 27.2% | 74.0% |
| Range | 26.7% | 72.5% |
| Mean | 9.8% | 12.7% |
| Median | 10.7% | 6.1% |
| Interquartile 25% (IQ1) | 4.9% | 4.8% |
| Interquartile 75% (IQ3) | 13.5% | 14.8% |
| Interquartile Range (IQR) | 8.6% | 10.0% |
| Standard Deviation (Sample) | 6.0% | 14.8% |
| Standard Deviation (Population) | 6.0% | 14.6% |
Similar Demographics by Receiving Food Stamps
Demographics Similar to Immigrants from Costa Rica by Receiving Food Stamps
In terms of receiving food stamps, the demographic groups most similar to Immigrants from Costa Rica are Portuguese (12.2%, a difference of 0.050%), Delaware (12.2%, a difference of 0.13%), Iraqi (12.2%, a difference of 0.21%), American (12.2%, a difference of 0.24%), and Immigrants from Sudan (12.1%, a difference of 0.30%).
| Demographics | Rating | Rank | Receiving Food Stamps |
| Venezuelans | 32.1 /100 | #191 | Fair 12.0% |
| Samoans | 31.0 /100 | #192 | Fair 12.1% |
| Immigrants | Fiji | 27.8 /100 | #193 | Fair 12.1% |
| Immigrants | Sudan | 27.1 /100 | #194 | Fair 12.1% |
| Americans | 26.7 /100 | #195 | Fair 12.2% |
| Iraqis | 26.6 /100 | #196 | Fair 12.2% |
| Delaware | 26.1 /100 | #197 | Fair 12.2% |
| Immigrants | Costa Rica | 25.4 /100 | #198 | Fair 12.2% |
| Portuguese | 25.1 /100 | #199 | Fair 12.2% |
| Sierra Leoneans | 23.6 /100 | #200 | Fair 12.2% |
| Ugandans | 22.5 /100 | #201 | Fair 12.2% |
| Immigrants | Venezuela | 20.1 /100 | #202 | Fair 12.3% |
| Shoshone | 17.7 /100 | #203 | Poor 12.4% |
| Immigrants | Nonimmigrants | 17.6 /100 | #204 | Poor 12.4% |
| Aleuts | 17.3 /100 | #205 | Poor 12.4% |
Demographics Similar to Immigrants from Northern Europe by Receiving Food Stamps
In terms of receiving food stamps, the demographic groups most similar to Immigrants from Northern Europe are Eastern European (9.2%, a difference of 0.020%), Immigrants from Ireland (9.2%, a difference of 0.10%), Immigrants from Australia (9.2%, a difference of 0.13%), Swedish (9.2%, a difference of 0.30%), and Luxembourger (9.1%, a difference of 0.38%).
| Demographics | Rating | Rank | Receiving Food Stamps |
| Immigrants | Scotland | 99.9 /100 | #17 | Exceptional 9.0% |
| Danes | 99.9 /100 | #18 | Exceptional 9.0% |
| Immigrants | Hong Kong | 99.8 /100 | #19 | Exceptional 9.1% |
| Latvians | 99.8 /100 | #20 | Exceptional 9.1% |
| Luxembourgers | 99.8 /100 | #21 | Exceptional 9.1% |
| Immigrants | Australia | 99.8 /100 | #22 | Exceptional 9.2% |
| Eastern Europeans | 99.8 /100 | #23 | Exceptional 9.2% |
| Immigrants | Northern Europe | 99.8 /100 | #24 | Exceptional 9.2% |
| Immigrants | Ireland | 99.8 /100 | #25 | Exceptional 9.2% |
| Swedes | 99.8 /100 | #26 | Exceptional 9.2% |
| Bhutanese | 99.8 /100 | #27 | Exceptional 9.2% |
| Czechs | 99.8 /100 | #28 | Exceptional 9.2% |
| Immigrants | Lithuania | 99.8 /100 | #29 | Exceptional 9.2% |
| Immigrants | Sweden | 99.7 /100 | #30 | Exceptional 9.3% |
| Immigrants | Eastern Asia | 99.7 /100 | #31 | Exceptional 9.3% |