Immigrants from Colombia vs Immigrants from Honduras Poverty
COMPARE
Immigrants from Colombia
Immigrants from Honduras
Poverty
Poverty Comparison
Immigrants from Colombia
Immigrants from Honduras
12.3%
POVERTY
47.7/ 100
METRIC RATING
176th/ 347
METRIC RANK
16.2%
POVERTY
0.0/ 100
METRIC RATING
320th/ 347
METRIC RANK
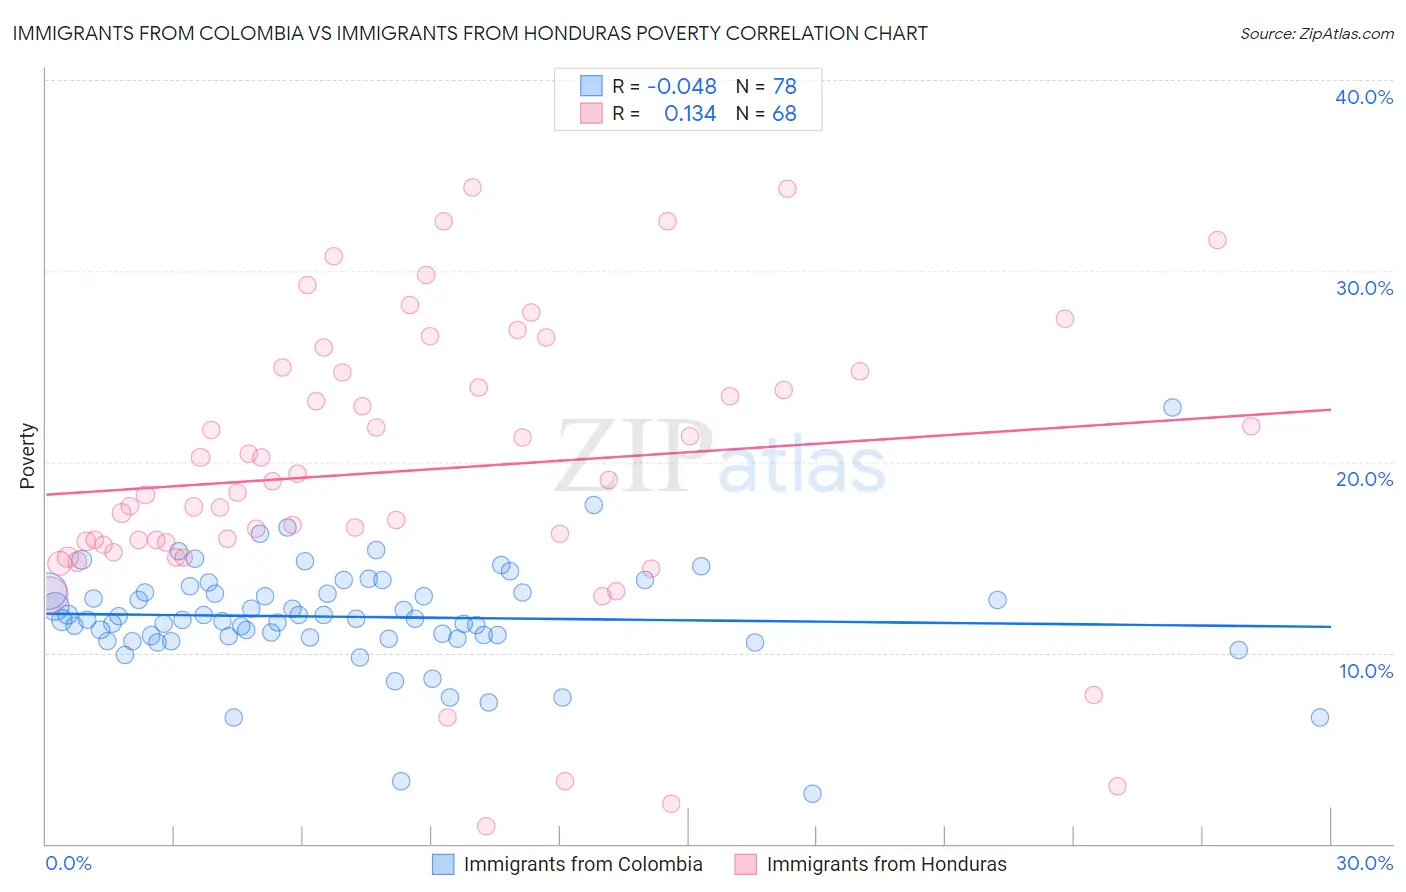
Immigrants from Colombia vs Immigrants from Honduras Poverty Correlation Chart
The statistical analysis conducted on geographies consisting of 378,485,502 people shows no correlation between the proportion of Immigrants from Colombia and poverty level in the United States with a correlation coefficient (R) of -0.048 and weighted average of 12.3%. Similarly, the statistical analysis conducted on geographies consisting of 322,477,641 people shows a poor positive correlation between the proportion of Immigrants from Honduras and poverty level in the United States with a correlation coefficient (R) of 0.134 and weighted average of 16.2%, a difference of 31.0%.
Poverty Correlation Summary
| Measurement | Immigrants from Colombia | Immigrants from Honduras |
| Minimum | 2.6% | 0.89% |
| Maximum | 22.8% | 34.4% |
| Range | 20.2% | 33.5% |
| Mean | 11.9% | 19.6% |
| Median | 11.8% | 18.7% |
| Interquartile 25% (IQ1) | 10.8% | 15.7% |
| Interquartile 75% (IQ3) | 13.2% | 24.7% |
| Interquartile Range (IQR) | 2.3% | 9.0% |
| Standard Deviation (Sample) | 2.8% | 7.5% |
| Standard Deviation (Population) | 2.8% | 7.4% |
Similar Demographics by Poverty
Demographics Similar to Immigrants from Colombia by Poverty
In terms of poverty, the demographic groups most similar to Immigrants from Colombia are Immigrants from Syria (12.3%, a difference of 0.020%), South American (12.3%, a difference of 0.090%), Lebanese (12.3%, a difference of 0.23%), Celtic (12.3%, a difference of 0.24%), and Immigrants from Portugal (12.3%, a difference of 0.28%).
| Demographics | Rating | Rank | Poverty |
| Whites/Caucasians | 55.4 /100 | #169 | Average 12.3% |
| Immigrants | Oceania | 54.6 /100 | #170 | Average 12.3% |
| Immigrants | Spain | 51.3 /100 | #171 | Average 12.3% |
| Immigrants | Portugal | 50.5 /100 | #172 | Average 12.3% |
| Celtics | 50.1 /100 | #173 | Average 12.3% |
| Lebanese | 50.0 /100 | #174 | Average 12.3% |
| South Americans | 48.7 /100 | #175 | Average 12.3% |
| Immigrants | Colombia | 47.7 /100 | #176 | Average 12.3% |
| Immigrants | Syria | 47.5 /100 | #177 | Average 12.3% |
| Uruguayans | 44.7 /100 | #178 | Average 12.4% |
| Immigrants | Morocco | 44.0 /100 | #179 | Average 12.4% |
| Mongolians | 43.6 /100 | #180 | Average 12.4% |
| Immigrants | Afghanistan | 42.1 /100 | #181 | Average 12.4% |
| Immigrants | Cameroon | 41.7 /100 | #182 | Average 12.4% |
| Immigrants | Iraq | 40.2 /100 | #183 | Average 12.4% |
Demographics Similar to Immigrants from Honduras by Poverty
In terms of poverty, the demographic groups most similar to Immigrants from Honduras are Immigrants from Congo (16.1%, a difference of 0.23%), Immigrants from Dominica (16.1%, a difference of 0.43%), U.S. Virgin Islander (16.1%, a difference of 0.72%), Arapaho (16.3%, a difference of 0.74%), and Menominee (16.4%, a difference of 1.7%).
| Demographics | Rating | Rank | Poverty |
| Immigrants | Grenada | 0.0 /100 | #313 | Tragic 15.8% |
| Immigrants | Somalia | 0.0 /100 | #314 | Tragic 15.8% |
| British West Indians | 0.0 /100 | #315 | Tragic 15.9% |
| Hondurans | 0.0 /100 | #316 | Tragic 15.9% |
| U.S. Virgin Islanders | 0.0 /100 | #317 | Tragic 16.1% |
| Immigrants | Dominica | 0.0 /100 | #318 | Tragic 16.1% |
| Immigrants | Congo | 0.0 /100 | #319 | Tragic 16.1% |
| Immigrants | Honduras | 0.0 /100 | #320 | Tragic 16.2% |
| Arapaho | 0.0 /100 | #321 | Tragic 16.3% |
| Menominee | 0.0 /100 | #322 | Tragic 16.4% |
| Colville | 0.0 /100 | #323 | Tragic 16.6% |
| Yakama | 0.0 /100 | #324 | Tragic 16.7% |
| Central American Indians | 0.0 /100 | #325 | Tragic 16.7% |
| Paiute | 0.0 /100 | #326 | Tragic 16.7% |
| Kiowa | 0.0 /100 | #327 | Tragic 16.8% |